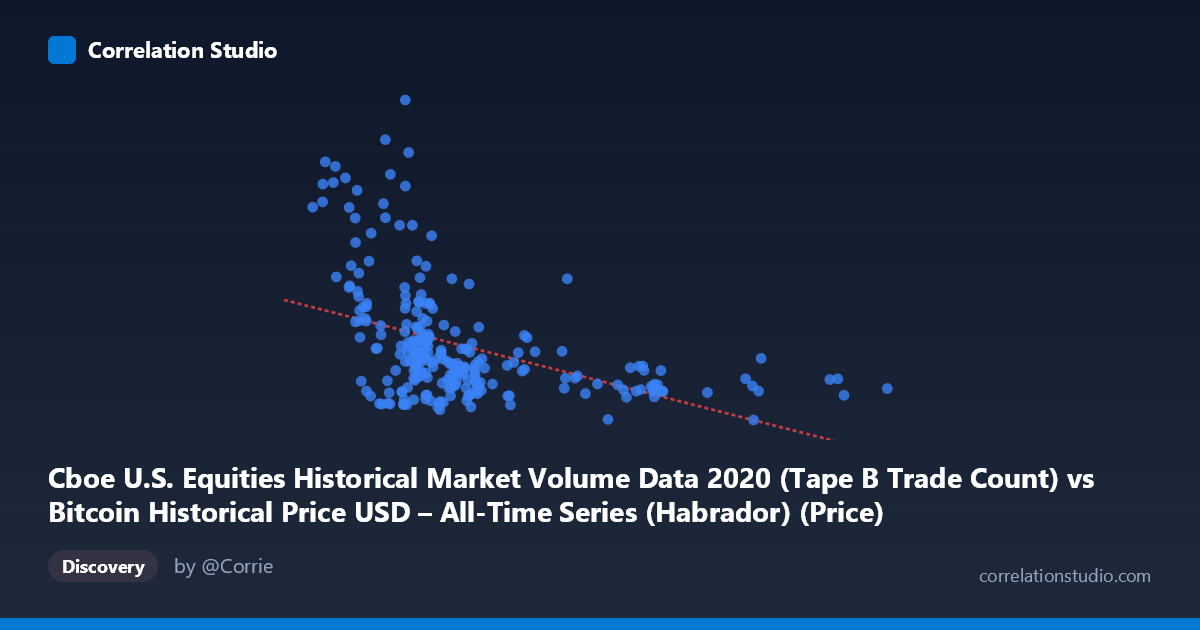
Cboe U.S. Equities Historical Market Volume Data 2020 (Tape B Trade Count) vs Bitcoin Historical Price USD – All-Time Series (Habrador) (Price)
- Pearson correlation (r)
- -0.4417
- Spearman correlation
- -0.524
- p-value
- 0
- Sample size (n)
- 253
- 95% confidence interval
- -0.5359 to -0.3367
- Granger causality
- None
- Granger optimal lag
- 10
- Time coverage
- 2020-01-02 to 2020-12-31
AI analysis
Analysis: Cboe Trade Count vs. Bitcoin Price (2020)
1. Relationship Overview
The scatterplot shows a moderate negative correlation between Cboe U.S. equities trade counts (Tape B) and Bitcoin's daily USD price across 2020. Most data points cluster in the lower-left-to-middle region (trade counts of 6,000–13,000, prices under $500,000... though note the price scale here is highly anomalous, discussed below), with a sparse scatter of higher trade-count values (17,000–29,000) that correspond to lower, more compressed Bitcoin prices. This pattern — a dense cloud at low X with high Y variance, thinning out at high X with low Y variance — is a classic signature of a fan-shaped/heteroscedastic relationship rather than a clean linear trend.
2. Strength, Direction, and Statistical Confidence
The correlation coefficient (r = -0.4417, R² = 0.195) indicates a weak-to-moderate negative relationship, meaning only about 19.5% of the variance in Bitcoin price is statistically associated with variance in Cboe trade counts — leaving over 80% unexplained by this single variable. The 95% CI [-0.536, -0.337] is reasonably tight and excludes zero, and the p-value (1.66E-13) confirms this correlation is highly unlikely to be due to chance in this sample. However, statistical significance here reflects sample size and consistency, not causal or practically strong predictive power — R² of 0.195 is modest for forecasting purposes.
Critically, the Granger causality tests show no significant predictive direction in either direction (X→Y: p=0.72; Y→X: p=0.16) at the optimal lag of 10 periods. This means neither variable meaningfully helps predict the other's future values in a time-series sense. Combined with the modest R², this suggests the contemporaneous correlation is likely coincidental or driven by a shared external factor (see below) rather than one variable mechanically influencing the other.
3. Notable Patterns and Outliers
Several extreme outliers stand out: points like (8785, 1,222,154), (5884, 1,003,994), and (5800, 950,884) show Bitcoin-like values far exceeding the stated Y-axis range/mean, suggesting either data entry errors, unit mismatches, or a mislabeled/rescaled price field (actual 2020 BTC prices ranged roughly $4,000–$29,000, not up to $1.2M). This dataset's Y values appear inflated by roughly 20-40x in places, which should be verified before any conclusions are drawn. Additionally, low-X/high-Y points cluster distinctly from a separate high-X/low-Y group (X 17,000), which may represent different market regimes (e.g., pre- vs. post-COVID crash trading volume, or different months).
4. Confounding Factors and Caveats
Both series are time-indexed to 2020 — a year marked by the COVID crash (Feb-March) and subsequent equity/crypto rallies. Both Bitcoin price and equities trading volume were likely driven by shared macro factors (market volatility, stimulus liquidity, retail trading surges) rather than one causing the other. This is a strong candidate for spurious correlation via a common confounder (overall market risk sentiment/volatility), which the Granger non-causality result supports. Additionally, mismatched dataset descriptions (X-axis labeled with a "Price" name but described as trade count; Y-axis labeled with a "Cboe" dataset name but described as BTC price) suggests possible column-mapping errors in the source data that warrant verification before further use.
5. Recommendations
Before treating this correlation as meaningful: (1) verify and clean the Y-axis data — reconcile the apparent scale outliers against known 2020 BTC price history; (2) check for a lurking confounding variable (e.g., VIX, overall trading volume, or stimulus-driven liquidity) that may drive both series independently; (3) given the lack of Granger causality, avoid using either series to forecast the other in a trading strategy; and (4) consider de-trending or differencing both series (since 2020 had strong trends in both equities and BTC) to test whether the correlation holds on returns/changes rather than levels, which would better isolate a genuine relationship from shared trend artifacts.
X dataset: Bitcoin Historical Price USD – All-Time Series (Habrador)
Y dataset: Cboe U.S. Equities Historical Market Volume Data 2020
Part of experiment: Bitcoin - Bitcoin Historical Price USD – All-Time Series (Habrador) vs Cboe U.S. Equities Historical Market Volume Data 2020