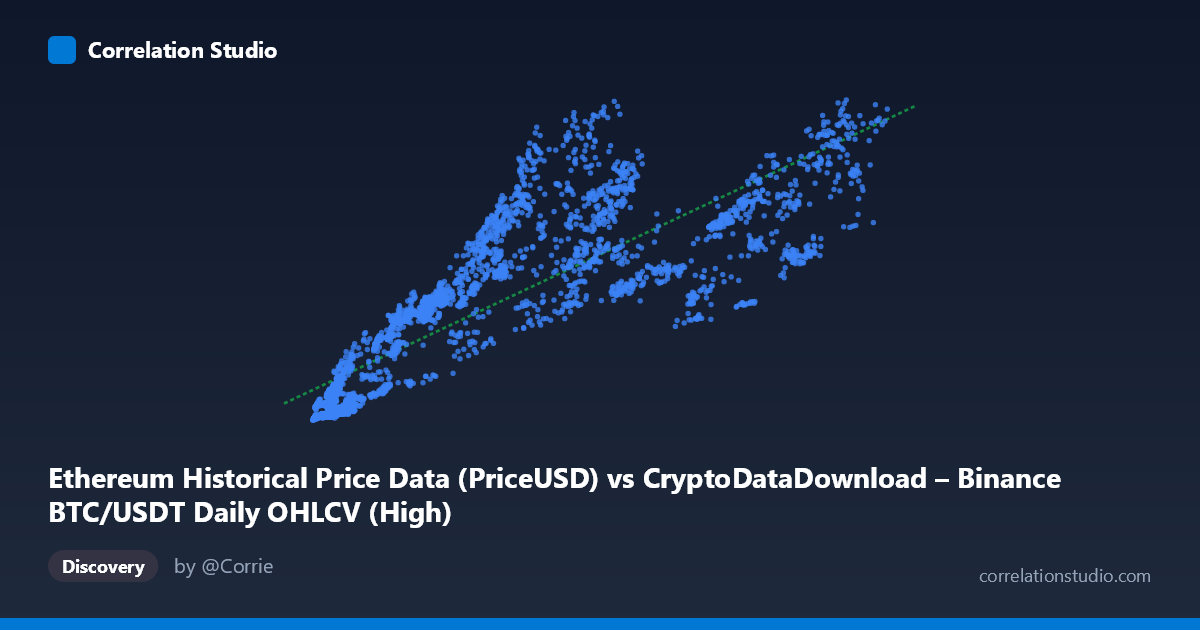
Ethereum Historical Price Data (PriceUSD) vs CryptoDataDownload – Binance BTC/USDT Daily OHLCV (High)
- Pearson correlation (r)
- 0.8417
- Spearman correlation
- 0.9084
- p-value
- 0
- Sample size (n)
- 3191
- 95% confidence interval
- 0.8313 to 0.8515
- Granger causality
- None
- Granger optimal lag
- 4
AI analysis
Analysis: BTC/USDT Price vs. Ethereum Price Relationship
1. Overview of the Relationship
The scatterplot depicts a strong positive association between Bitcoin price (X-axis) and Ethereum price (Y-axis) across 3,191 paired daily observations spanning 2017–2026. As Bitcoin's price rises from roughly $3,300 to $126,000, Ethereum's price generally climbs in tandem from under $100 to nearly $4,800. The sample points confirm a clear upward trend, though the relationship is not perfectly linear — dispersion increases notably at higher Bitcoin price levels, and Ethereum shows meaningful scatter around any given Bitcoin price point (e.g., at BTC≈84,000, ETH ranges from ~1,565 to ~1,879; at BTC≈9,000–12,000, ETH ranges widely from ~185 to over 1,000).
2. Strength, Direction, and Statistical Confidence
The correlation coefficient (r = 0.842) indicates a strong positive linear relationship, with r² = 0.709 meaning approximately 71% of the variance in Ethereum's price is statistically explained by Bitcoin's price movements. This leaves ~29% of ETH price variance driven by other factors — ETH-specific fundamentals, altcoin cycle dynamics, or market-specific events. The 95% confidence interval [0.831, 0.852] is tight, reflecting high precision given the large sample size, and the p-value of 0 confirms the correlation is not due to chance. However, the Granger causality tests are critical for interpretation: neither BTC→ETH nor ETH→BTC shows significant predictive causality (p = 0.359 and p = 0.541 respectively) at the optimal lag of 4 periods. This means the strong correlation is contemporaneous/structural rather than one price leading the other in time — both assets likely respond to shared external drivers (macro liquidity, crypto market sentiment, regulatory news) rather than one causally driving the other's future values.
3. Notable Patterns and Non-Linear Features
Several features stand out: (1) Heteroscedasticity — variance in ETH price widens considerably as BTC price increases, suggesting the relationship may not be strictly linear and could benefit from a log-log transformation, common in asset-price analysis. (2) Low-price cluster anomalies — at low BTC values (~$8,000–12,000), ETH prices vary dramatically (from ~$185 to ~$1,050), likely reflecting different market eras (e.g., 2017 ICO boom vs. later bear-market lows) where BTC/ETH ratios differed structurally. (3) High-price convergence — at BTC $100,000, ETH clusters more tightly in the $4,000–4,300 range, hinting at a possible ceiling effect or maturation of the relationship in bull-market peaks.
4. Confounding Factors and Caveats
This correlation is likely confounded by shared market regime effects: both cryptocurrencies are driven by common macro factors (overall crypto market cap, Bitcoin dominance shifts, regulatory announcements, institutional adoption waves, and liquidity cycles) rather than a direct causal price mechanism. The data also spans multiple distinct market cycles (2017 ICO mania, 2018 crash, 2020–21 bull run, 2022 bear market, subsequent recovery), and pooling these regimes into a single linear fit may mask regime-specific relationships (e.g., ETH/BTC ratio compression during alt-season vs. BTC-dominance periods). Additionally, since both series are derived from the same exchange (Binance) and quote currency (USDT), they share stablecoin-related and exchange-specific liquidity conditions, which is a structural confound rather than a fundamental economic one.
5. Recommendations for Further Investigation
To deepen this analysis: (1) Transform to log-returns rather than raw prices to test correlation of daily/weekly percentage changes, which better isolates genuine co-movement from shared trend/inflation effects. (2) Segment by market regime (bull/bear/sideways) to check if r² and the regression slope are stable or vary by cycle phase. (3) Test the ETH/BTC ratio directly over time to identify alt-season vs. BTC-dominance periods invisible in raw price correlation. (4) Given the null Granger causality result, consider higher-frequency data (hourly) or alternative causality frameworks (e.g., transfer entropy) to detect any lead-lag relationship obscured at daily resolution. (5) Incorporate a third variable — such as total crypto market cap or stablecoin supply — as a control to test whether the BTC-ETH relationship is truly bilateral or mediated by a common latent factor.
X dataset: CryptoDataDownload – Binance BTC/USDT Daily OHLCV
Y dataset: Ethereum Historical Price Data
Part of experiment: Bitcoin - CryptoDataDownload – Binance BTC/USDT Daily OHLCV vs Ethereum Historical Price Data