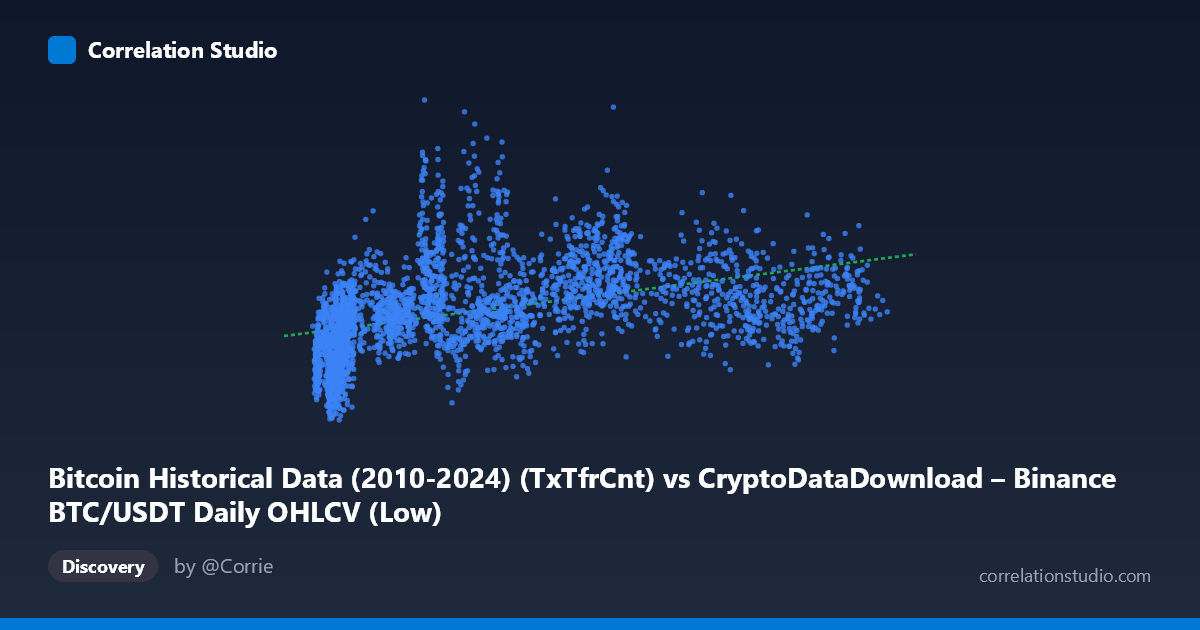
Bitcoin Historical Data (2010-2024) (TxTfrCnt) vs CryptoDataDownload – Binance BTC/USDT Daily OHLCV (Low)
- Pearson correlation (r)
- 0.4337
- Spearman correlation
- 0.6007
- p-value
- 0
- Sample size (n)
- 3191
- 95% confidence interval
- 0.4051 to 0.4614
- Granger causality
- None
- Granger optimal lag
- 10
- Time coverage
- 2017-08-17 to 2026-05-20
AI analysis
Analysis: Transaction Count (X) vs. BTC Price Low (Y)
1. Overview of the Relationship
The scatterplot shows a positive but noisy association between daily Bitcoin transaction count and the daily low price on Binance BTC/USDT. Points are widely scattered rather than tightly hugging a line, and the data appears to fan out with heteroskedasticity — variance in Y increases at lower X values, with several high-price points (1.2M) occurring at relatively modest transaction counts (25,000–70,000), suggesting the relationship is not a simple linear one.
2. Strength, Direction, and Predictive Power
The Pearson correlation (r = 0.434) indicates a moderate positive relationship, and with r² = 0.188, transaction count explains only about 19% of the variance in price lows — meaning roughly 81% of price movement is driven by other factors. The 95% CI [0.405, 0.461] is fairly tight given the large sample (n=3,191), and the p-value of ~0 confirms this correlation is statistically robust and not due to chance. However, statistical significance here reflects the large sample size more than practical predictive strength — a moderate r with r² under 0.2 means transaction count alone is a weak standalone price predictor. Critically, the Granger causality tests show no significant predictive direction in either direction (X→Y: p=0.216; Y→X: p=0.915) at the tested lag structure. This means neither variable reliably "leads" the other in time — the correlation is likely contemporaneous/structural (both driven by common market cycles) rather than one causing or forecasting the other.
3. Notable Patterns and Outliers
Several notable features stand out: - Price spikes without proportional transaction growth: Points like (25,166 → 1,210,147) and (41,965 → 1,383,459) and (30,200 → 1,179,617) show high prices at low-to-moderate transaction counts, likely corresponding to euphoric bull-market phases (possibly 2021 or 2024-25 rallies) where price surged on speculation/leverage rather than proportional on-chain usage. - Low-price, low-transaction cluster: Many points cluster in the 5,000–15,000 transaction range with prices between 400,000–900,000, likely representing bear/consolidation periods. - High-transaction, moderate-price points (e.g., 98,657 → 852,734; 109,977 → 834,829) suggest periods of high network activity that didn't correspond to peak prices — possibly network congestion during sell-offs or non-price-driven usage (e.g., ordinals/inscriptions activity in 2023-24). - The Spearman ρ Pearson r hint reinforces that a monotonic but non-linear (e.g., logarithmic or power-law) relationship fits better — consistent with typical crypto market scaling behavior.
4. Confounding Factors and Caveats
Several confounds likely inflate or distort the raw correlation: - Trend/non-stationarity: Both BTC price and transaction count trended over the 2017–2026 window across multiple bull/bear cycles. Two non-stationary series will often show spurious correlation independent of true causal linkage. - Third-variable drivers: Macro liquidity conditions, exchange listings, halving cycles, regulatory news, and speculative leverage likely drive both price and transaction volume simultaneously, without one causing the other. - Transaction count ambiguity: On-chain tx count can be inflated by non-economic activity (dust transactions, inscriptions/ordinals, batching by exchanges) unrelated to genuine demand or price. - Scale mismatch units: Combining two differently-sourced datasets (on-chain metrics vs. exchange OHLCV) risks timestamp misalignment or reporting inconsistencies.
5. Recommendations for Further Investigation
Given the weak linear fit and lack of Granger causality, analysts should: (1) test log-transformed or polynomial regression models to capture the suspected non-linear scaling relationship; (2) de-trend both series (e.g., first-differencing or percentage changes) before re-running correlation/Granger tests to rule out spurious trend-driven correlation; (3) segment the analysis by market regime (bull vs. bear vs. consolidation) since the relationship likely varies by cycle phase; and (4) incorporate additional variables (active addresses, exchange inflows, realized cap, macro liquidity indices) in a multivariate model, since transaction count alone explains under 20% of price variance and clearly isn't a standalone leading indicator.
X dataset: CryptoDataDownload – Binance BTC/USDT Daily OHLCV
Y dataset: Bitcoin Historical Data (2010-2024)
Part of experiment: Bitcoin - CryptoDataDownload – Binance BTC/USDT Daily OHLCV vs Bitcoin Historical Data (2010-2024)