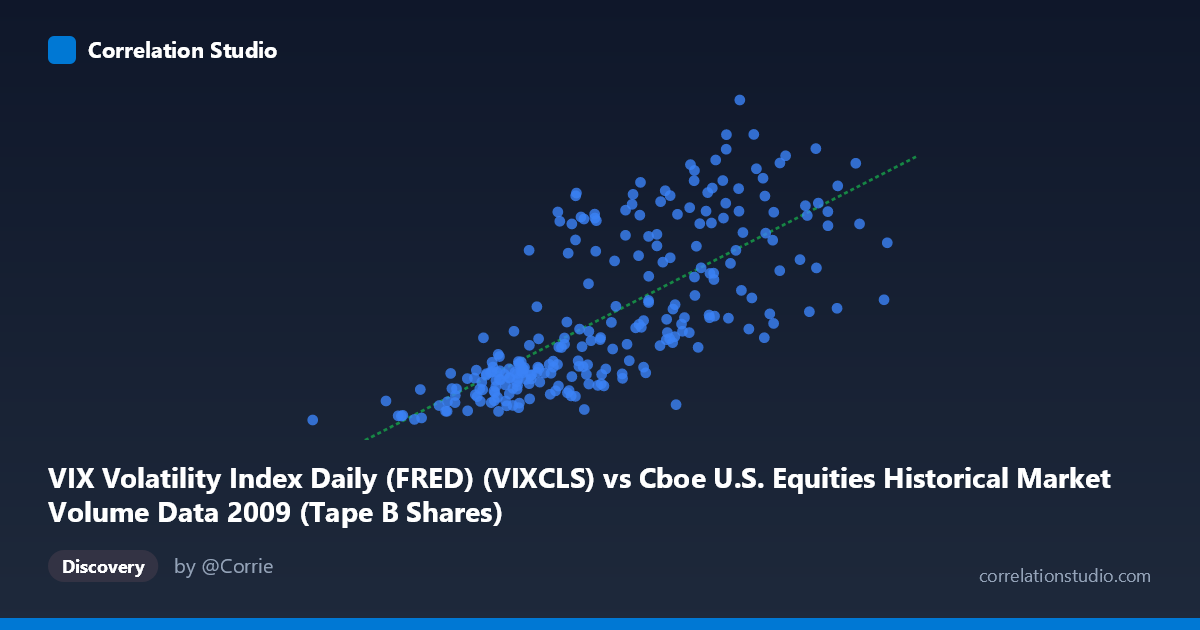
VIX Volatility Index Daily (FRED) (VIXCLS) vs Cboe U.S. Equities Historical Market Volume Data 2009 (Tape B Shares)
- Pearson correlation (r)
- 0.7295
- Spearman correlation
- 0.789
- p-value
- 0
- Sample size (n)
- 252
- 95% confidence interval
- 0.666 to 0.7825
- Granger causality
- None
- Granger optimal lag
- 1
AI analysis
Analysis: VIX Volatility Index vs. Cboe Tape B Share Volume (2009)
Relationship Overview The scatterplot reveals a moderately strong positive relationship between daily U.S. equity market volume (Tape B shares) on the X-axis and the VIX Volatility Index on the Y-axis across 2009 trading days. As market volume increases, VIX levels tend to rise commensurately, which aligns intuitively with the well-established financial market dynamic where heightened fear and uncertainty drive both increased trading activity and elevated implied volatility. The linear regression equation (y = 1.55×10⁻⁷x + 8.75) confirms this upward slope, though the intercept near 8.75 suggests a baseline VIX level even at minimal volume levels.
Correlation Strength and Statistical Significance The Pearson correlation of r = 0.7295 indicates a meaningful positive association, with r² = 0.5322 revealing that approximately 53.2% of the variance in VIX is explained by Tape B share volume — a substantial but incomplete explanatory picture, meaning nearly half the VIX variance is driven by other factors entirely. The 95% confidence interval of [0.6660, 0.7825] is relatively tight, reflecting the robust sample size (n = 252 paired observations from a population of N = 3,232), and the p-value of effectively zero confirms this correlation is statistically indistinguishable from chance. However, the Granger causality results are notably sobering: neither direction (X→Y: F = 0.077, p = 0.781; Y→X: F = 0.025, p = 0.876) achieves significance at lag-1, meaning neither variable reliably predicts the other on the following day. This distinguishes a contemporaneous co-movement relationship from a temporally predictive one — volume and VIX rise together, but knowing today's volume does not meaningfully forecast tomorrow's VIX, and vice versa.
Notable Patterns, Clusters, and Outliers The data exhibits a clear two-regime structure. A dense lower-left cluster dominates the chart, with volume roughly in the 80–140 million share range and VIX values between 19 and 30, likely corresponding to the calmer second half of 2009 as markets recovered. A second, more dispersed upper-right cluster (volume 160–255 million, VIX 30–57) likely reflects the volatile early-2009 period surrounding the financial crisis nadir. The point near (33.8M shares, VIX 19.47) stands out as a clear low-volume outlier and may represent a shortened trading session or holiday-adjacent day. Several high-VIX observations above 50 (e.g., the point near 204M shares, VIX 52.65) suggest extreme stress episodes that may exert disproportionate leverage on the regression fit.
Confounding Factors and Caveats Several important caveats apply. First, 2009 is an extraordinary year — the dataset spans the tail of the worst financial crisis since the Great Depression, with VIX readings that were historically anomalous. The correlation observed here may not generalize to normal market conditions. Second, Tape B shares specifically (NYSE American/regional exchanges) may not uniformly represent broad market sentiment, and mixing this with a cross-market fear index introduces potential measurement mismatch. Third, the contemporaneous correlation likely reflects a shared common driver — systemic market stress — rather than a direct volume-to-VIX mechanism. Days with major macro news events, Fed announcements, or earnings shocks simultaneously spike both volume and volatility, creating a spurious-looking bilateral relationship. Finally, the lag-1 Granger non-result may be sensitive to the chosen lag length; longer lags or intraday data could reveal different dynamics.
Actionable Insights and Further Investigation Practitioners monitoring market stress signals should treat elevated Tape B volume as a coincident indicator of rising VIX rather than a leading one — useful for confirming stress regimes but not for next-day forecasting. For further investigation, it would be valuable to: (1) extend Granger causality testing to lags 2–10 to check for slower feedback effects; (2) segment the data by market regime (pre/post March 2009 market bottom) to test whether the correlation is structurally stable or crisis-driven; (3) include additional volume tapes (A and C) and total consolidated volume to assess whether the relationship is Tape B-specific or market-wide; and (4) apply a non-linear model (e.g., piecewise regression or LOWESS smoothing) given the apparent clustering, since the linear fit may mask threshold effects at extreme volume levels.
X dataset: Cboe U.S. Equities Historical Market Volume Data 2009
Y dataset: VIX Volatility Index Daily (FRED)
Part of experiment: Daily - Cboe U.S. Equities Historical Market Volume Data 2009 vs VIX Volatility Index Daily (FRED)