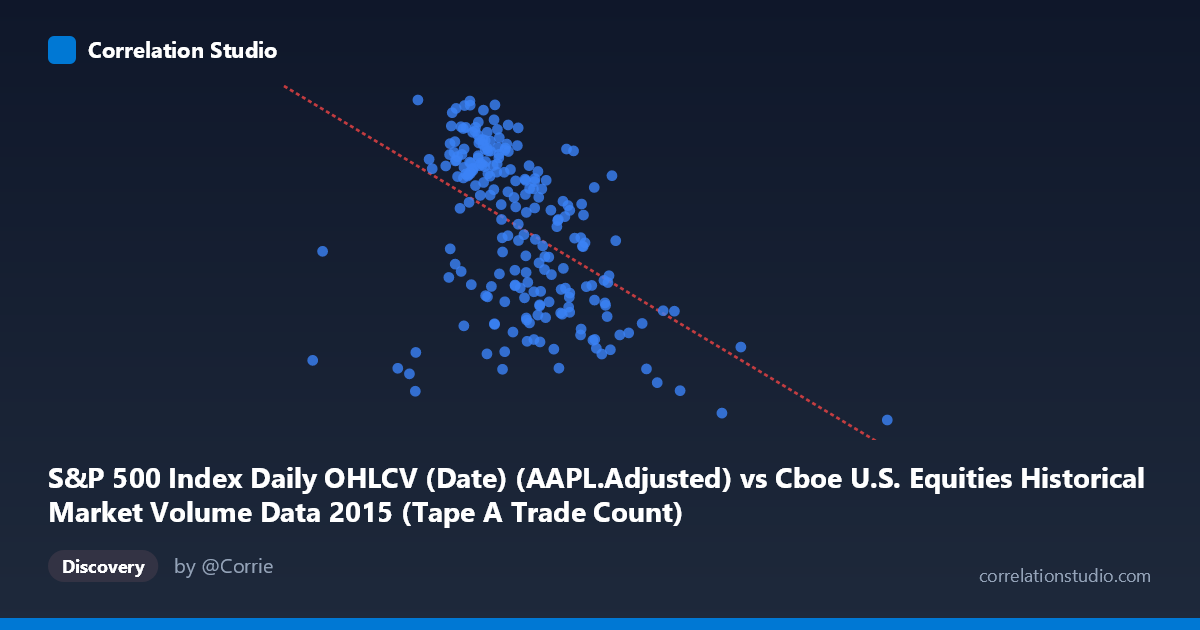
S&P 500 Index Daily OHLCV (Date) (AAPL.Adjusted) vs Cboe U.S. Equities Historical Market Volume Data 2015 (Tape A Trade Count)
- Pearson correlation (r)
- -0.4907
- Spearman correlation
- -0.5389
- p-value
- 0
- Sample size (n)
- 222
- 95% confidence interval
- -0.5846 to -0.3838
- Granger causality
- None
- Granger optimal lag
- 1
AI analysis
Scatterplot Analysis: AAPL Adjusted Price vs. Cboe Tape A Trade Count (2015)
Relationship Overview The scatterplot reveals a negative relationship between AAPL's adjusted closing price (X-axis) and the Cboe U.S. Equities Tape A Trade Count (Y-axis) across the 2015 trading year. As AAPL's price increased, the number of Tape A trades tended to decrease, and conversely, lower AAPL price levels coincided with higher trade counts. The linear regression equation (y = -1.28267E-05x + 135.077) quantifies this inverse slope, suggesting that for every unit increase in AAPL's adjusted price, the Tape A trade count declines by a very small but consistent increment. This pattern is broadly consistent with a market dynamic where declining equity prices — particularly in a bellwether stock like AAPL — coincide with elevated trading activity driven by defensive repositioning, stop-loss triggers, and opportunistic buying.
Correlation Strength and Statistical Significance The Pearson correlation of r = -0.4907 indicates a moderate negative association. Critically, the R² of 0.2407 tells us that AAPL's adjusted price explains only about 24.1% of the variance in Tape A trade counts — meaning roughly 75.9% of the variation remains unexplained by this single predictor. The 95% confidence interval of [-0.5846, -0.3838] is notably narrow and does not cross zero, and the p-value of 7.55E-15 is extraordinarily small, making it essentially certain that this correlation is not a statistical artifact of sampling. However, statistical significance here is partly a function of the large sample size (N = 506 population, n = 222 paired observations); a real but modest effect can appear highly significant with sufficient data. The Granger causality results offer a particularly important caveat: neither direction (X→Y or Y→X) shows significant temporal predictability (X→Y: F = 0.272, p = 0.603; Y→X: F = 0.094, p = 0.760). This means that even though the two variables are correlated contemporaneously, past values of AAPL's price do not meaningfully predict future Tape A trade counts, and vice versa — ruling out a simple lagged causal mechanism between the two.
Notable Patterns, Clusters, and Outliers The sample points reveal a moderately dense central cluster where AAPL's adjusted price sits between approximately 1,150,000 and 1,600,000 (in the dataset's native units) and trade counts range from roughly 110 to 127. Within this core cluster, the negative trend is visible but noisy, with considerable vertical scatter suggesting other forces are at work. Two prominent outliers stand out immediately: the point near (2,923,236, 100.01) and another near (2,247,816, 100.61) — both sitting far to the right of the main distribution with unusually low trade counts. These high-X, low-Y outliers exert meaningful leverage on the regression line and likely drive a disproportionate share of the observed correlation. A third lower-left outlier around (576,208, ~114.75) and another near (971,306, 104.04) suggest the relationship may not be strictly linear across the full range of AAPL prices, hinting at potential non-linearity or regime differences at the extremes of the distribution.
Confounding Factors and Interpretive Caveats Several important confounds complicate a straightforward interpretation. First, both variables are time-series observations from the same calendar period (February–December 2015), meaning shared temporal trends — such as the broad market selloff in August 2015 — could simultaneously depress AAPL prices and spike overall trading volumes, creating a spurious or inflated correlation. Second, the axis labels appear to be swapped relative to intuitive expectation: the dataset notes indicate AAPL adjusted price is on the X-axis drawn from the Cboe dataset, and Tape A trade count is on the Y-axis drawn from the S&P 500 OHLCV dataset — suggesting a data join or labeling inversion that warrants verification before drawing firm conclusions. Third, Tape A trade counts reflect activity across all NYSE-listed equities, not AAPL specifically, so the connection is market-wide rather than stock-specific. Finally, the two extreme outliers (X 2,000,000) may represent data quality issues, encoding errors, or exceptional market events that should be investigated and potentially excluded from or separately analyzed within the regression.
Actionable Insights and Further Investigation Given the moderate correlation, meaningful unexplained variance, and absent Granger causality, practitioners should avoid using AAPL price alone as a predictive signal for Tape A trade volume in any operational or trading context. However, the contemporaneous relationship does suggest that AAPL's price level serves as a useful sentiment proxy worth including in a multi-factor model alongside VIX, broader index levels, and macroeconomic event indicators. Immediate next steps should include: (1) verifying and correcting the apparent axis/dataset label mismatch; (2) removing or separately flagging the two extreme high-X outliers and re-running the regression to assess their influence on R² and slope; (3) testing non-linear fits (logarithmic or piecewise) given the visual clustering pattern; and (4) incorporating the August 2015 volatility event as a dummy variable to isolate whether the correlation is driven primarily by that single market stress episode rather than a stable structural relationship throughout the year.
X dataset: Cboe U.S. Equities Historical Market Volume Data 2015
Y dataset: S&P 500 Index Daily OHLCV (Date)
Part of experiment: Daily - Cboe U.S. Equities Historical Market Volume Data 2015 vs S&P 500 Index Daily OHLCV (Date)