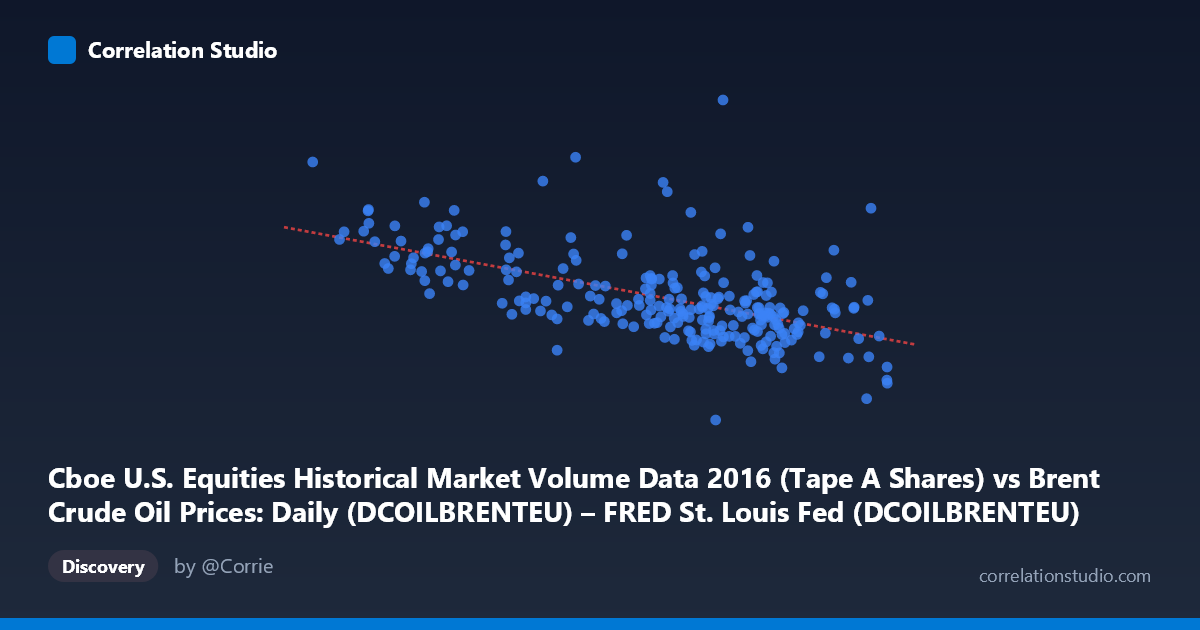
Cboe U.S. Equities Historical Market Volume Data 2016 (Tape A Shares) vs Brent Crude Oil Prices: Daily (DCOILBRENTEU) – FRED St. Louis Fed (DCOILBRENTEU)
- Pearson correlation (r)
- -0.5768
- Spearman correlation
- -0.5678
- p-value
- 0
- Sample size (n)
- 251
- 95% confidence interval
- -0.654 to -0.4879
- Granger causality
- None
- Granger optimal lag
- 10
AI analysis
Analysis: Brent Crude Oil Price vs. U.S. Equity Market Volume (2016)
Relationship Overview
The scatterplot reveals a moderate negative relationship between the daily Brent crude oil spot price (X-axis, USD/barrel) and U.S. equity market trading volume on Cboe/Tape A (Y-axis, shares). As crude oil prices rise across their 2016 range of roughly $26–$55/barrel, equity trading volumes tend to decline from peaks near 450–540 million shares toward lower levels around 175–230 million shares. This inverse pattern is visually apparent, with the highest volume observations clustering at the lower end of the oil price range and a downward trend running through the bulk of the data cloud.
Correlation Strength and Statistical Interpretation
The Pearson correlation of r = -0.5768 reflects a moderate negative association, and the linear regression equation (y = -5,042,400x + 493,190,000) quantifies this: each $1/barrel increase in Brent crude is associated with approximately 5 million fewer shares traded. However, the R² of 0.3328 means that only about 33.3% of the variance in trading volume is explained by oil prices alone — a meaningful but far from dominant share, implying that roughly two-thirds of volume variation stems from other factors entirely. The 95% confidence interval for r of [-0.654, -0.488] is reassuringly narrow and excludes zero, and the p-value reported as effectively 0 confirms this is highly unlikely to be a chance finding given the sample of 251 paired observations drawn from a population of 3,622. That said, statistical significance does not imply practical sufficiency — the unexplained variance is substantial.
Critically, the Granger causality tests show no significant temporal predictive relationship in either direction (X→Y: F = 1.04, p = 0.41; Y→X: F = 0.53, p = 0.86, both at a 10-period optimal lag). This means that even though a contemporaneous correlation exists, neither variable reliably leads or predicts the other in time. This is a meaningful constraint: the correlation appears to reflect a shared response to common macro forces rather than any directional causal mechanism.
Notable Patterns, Clusters, and Outliers
Several features stand out beyond the central trend. At the low end of oil prices (~$26–$34/barrel), a cluster of high-volume outliers sits well above the regression line — points like (26.01, 458M), (27.59, 363M), and (31.83, 340M) — likely corresponding to the volatile January–February 2016 period when oil hit multi-year lows and market stress drove elevated trading activity. Conversely, the upper oil price range (~$48–$53/barrel) shows considerable vertical scatter, with volumes spanning from roughly 175M to 325M shares, indicating the relationship weakens at higher price levels. A handful of points at extreme Y values (above 450M shares) appear as genuine outliers that likely exert disproportionate influence on the regression slope. The data cloud also suggests possible heteroscedasticity — variance in volume appears higher at low oil prices and compresses somewhat at higher prices.
Confounding Factors and Caveats
Several important caveats apply. First, 2016 was an unusually eventful year — beginning with a global oil price crash, followed by OPEC supply discussions, the Brexit vote (June), and the U.S. presidential election (November) — all of which independently drove both oil price moves and equity volume spikes. These events represent common drivers that create correlated movements without implying any direct oil-volume relationship. Second, equity trading volume is influenced by a vast array of factors — VIX levels, macroeconomic data releases, earnings seasons, Federal Reserve policy — most of which are unrelated to oil prices. Third, the axis labels in the original dataset appear swapped (the X-axis is labeled as the oil price column from the volume dataset and vice versa), which warrants verification before drawing firm conclusions. Finally, this is a cross-sectional daily correlation over a single calendar year; results may not generalize to other periods.
Actionable Insights and Further Investigation
Several avenues merit further exploration. Segmenting the data by market regime — specifically isolating the Q1 2016 oil crash period from the more stable H2 2016 — would test whether the correlation is driven primarily by that high-volatility cluster or is consistent throughout the year. Adding volatility controls (e.g., VIX, oil implied volatility) as covariates in a multivariate regression would help isolate whether oil price itself carries explanatory power or is merely a proxy for broader risk-off sentiment. Given the Granger null result, researchers should investigate contemporaneous common factors such as risk appetite indices or commodity-equity correlation regimes. It would also be valuable to replicate this analysis across multiple years to determine whether 2016's unique macro environment makes this correlation anomalous. Finally, examining sector-level volume (e.g., energy stocks vs. technology stocks) could reveal whether the aggregate relationship masks stronger or weaker dynamics within oil-sensitive industries.
X dataset: Brent Crude Oil Prices: Daily (DCOILBRENTEU) – FRED St. Louis Fed
Y dataset: Cboe U.S. Equities Historical Market Volume Data 2016
Part of experiment: Daily - Brent Crude Oil Prices: Daily (DCOILBRENTEU) – FRED St. Louis Fed vs Cboe U.S. Equities Historical Market Volume Data 2016