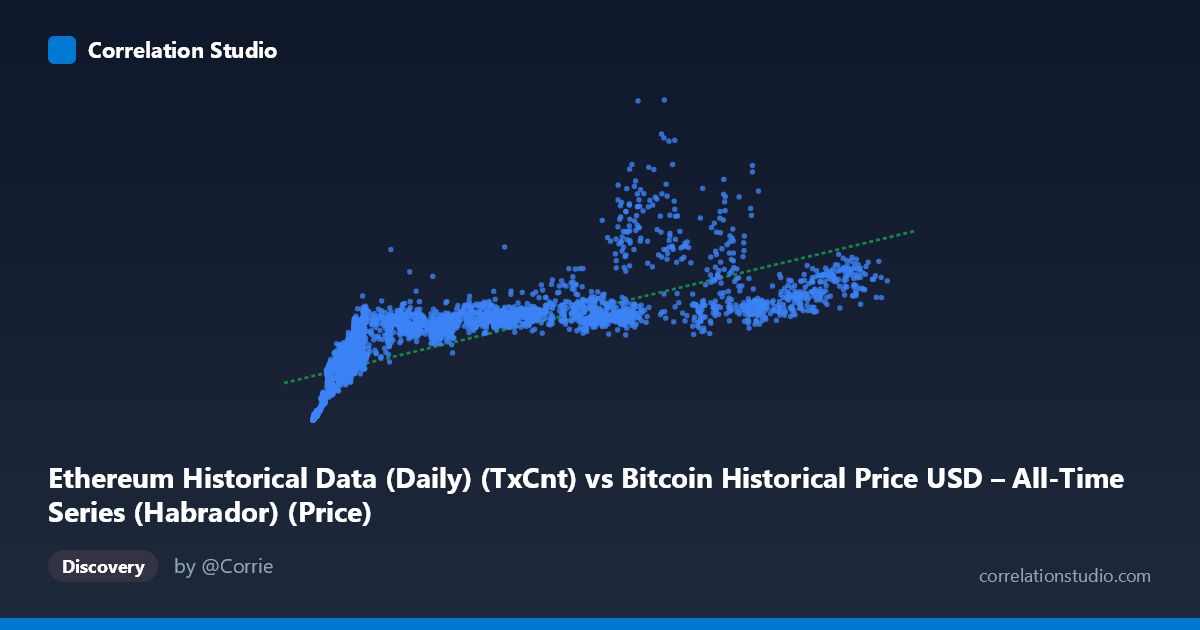
Ethereum Historical Data (Daily) (TxCnt) vs Bitcoin Historical Price USD – All-Time Series (Habrador) (Price)
- Pearson correlation (r)
- 0.7644
- Spearman correlation
- 0.9361
- p-value
- 0
- Sample size (n)
- 3926
- 95% confidence interval
- 0.7511 to 0.7771
- Granger causality
- None
- Granger optimal lag
- 10
AI analysis
Analysis: Ethereum Transaction Count vs. Bitcoin Price
1. What the Visualization Reveals
The scatterplot shows a positive, moderately strong association between Ethereum daily transaction count (X) and Bitcoin price (Y). As ETH transaction activity rises, BTC price tends to rise as well, but the relationship is far from a clean straight line. The sample points illustrate a classic "fan" or "curved" pattern: at low transaction counts (roughly under 10,000), Bitcoin prices span an enormous range — from ~$8,000 to over $1.2 million-scale values in this dataset's units — while at high transaction counts (80,000+), Bitcoin prices cluster more tightly in the $1.1M–$1.8M range. This compression at the high end and wide dispersion at the low end is a strong visual signature of a non-linear (likely logarithmic or power-law) relationship rather than a simple linear one.
2. Strength, Direction, and Statistical Confidence
The Pearson correlation (r = 0.7644) indicates a fairly strong positive linear relationship, with r² = 0.5843 meaning the linear model explains about 58% of the variance in Bitcoin price — leaving 42% unexplained by transaction count alone. The tight confidence interval [0.7511, 0.7771] combined with p ≈ 0 confirms this correlation is highly statistically reliable and not a sampling artifact, given the large sample size (n = 3,926). However, correlation strength should not be conflated with predictive or causal power: the Granger causality tests show no significant predictive direction in either direction (X→Y: p=0.81; Y→X: p=0.87). This means that despite the contemporaneous statistical association, past values of ETH transaction counts do not help forecast future BTC prices, and vice versa. Practically, this suggests both series may be driven by a common underlying factor (e.g., overall crypto market cycles, adoption trends, or macro sentiment) rather than one causing the other over time.
3. Notable Patterns and Outliers
Several features stand out: - Non-linearity: The note that Spearman ρ exceeds Pearson r is a strong signal that a monotonic but curved relationship (log or power function) fits better than a straight line. This aligns with the visual clustering/compression pattern described above. - Low-X variance cluster: Many points with X < 10,000 show Y values ranging from ~$8,000 to $1.29M — an enormous spread that a linear fit cannot capture well, and which likely drives down the overall r². - Ceiling effect at high X: Points with X 60,000 tend to sit in a narrower, elevated Y band (~$1.05M–$2.56M), suggesting diminishing marginal price increase per additional transaction — consistent with logarithmic saturation. - Potential regime clusters: The data may represent multiple market cycles (bull/bear) collapsed into one scatter; separating by time period could reveal distinct linear relationships within each cycle that differ from the pooled trend.
4. Confounding Factors and Caveats
This pairing is unusual: it correlates an Ethereum network activity metric with Bitcoin's market price — two different assets. Any correlation here is almost certainly mediated by shared macro-level drivers: overall crypto market sentiment, retail/institutional adoption waves, regulatory news, liquidity conditions, and bull/bear cycle timing that affect both ecosystems simultaneously. This is a textbook case of potential spurious correlation via a common confounder (broad market cycles) rather than a direct mechanical link. Additionally, the extreme range of both variables (X spans ~600x, Y spans ~3600x) means the correlation coefficient can be heavily influenced by scaling and outliers at the extremes. The long time coverage (2015–2026) spans vastly different market maturity phases, network usage patterns (e.g., DeFi/NFT booms affecting ETH tx counts independent of BTC price), and Ethereum protocol changes (e.g., Merge, EIP-1559) that could structurally alter the X variable's meaning over time.
5. Actionable Insights and Further Investigation
- Refit non-linearly: Given the Spearman/Pearson discrepancy and visual saturation pattern, test log(X) vs. Y or log-log models, which likely will substantially improve fit over the current 58.4% R². - Segment by market era: Break the data into cycle-specific windows (e.g., 2015-2017, 2017-2020, 2020-2022, 2023+) to check whether the relationship's slope/intercept is stable or regime-dependent. - Control for common confounders: Introduce a market-wide sentiment or total crypto market cap variable to test whether the ETH-tx/BTC-price correlation shrinks once shared drivers are controlled for (partial correlation analysis). - Do not use for trading signals: Given the null Granger causality result, this relationship should not be used to predict future BTC price movements from ETH transaction trends, or vice versa — the correlation is contemporaneous/structural, not predictive. - Investigate lag structure further: While lag-10 Granger tests were insignificant, consider testing shorter lags (1-5 days) or non-linear causality tests (e.g., transfer entropy) since crypto markets often exhibit fast information transmission that longer lags may dilute.
X dataset: Bitcoin Historical Price USD – All-Time Series (Habrador)
Y dataset: Ethereum Historical Data (Daily)
Part of experiment: Bitcoin - Bitcoin Historical Price USD – All-Time Series (Habrador) vs Ethereum Historical Data (Daily)