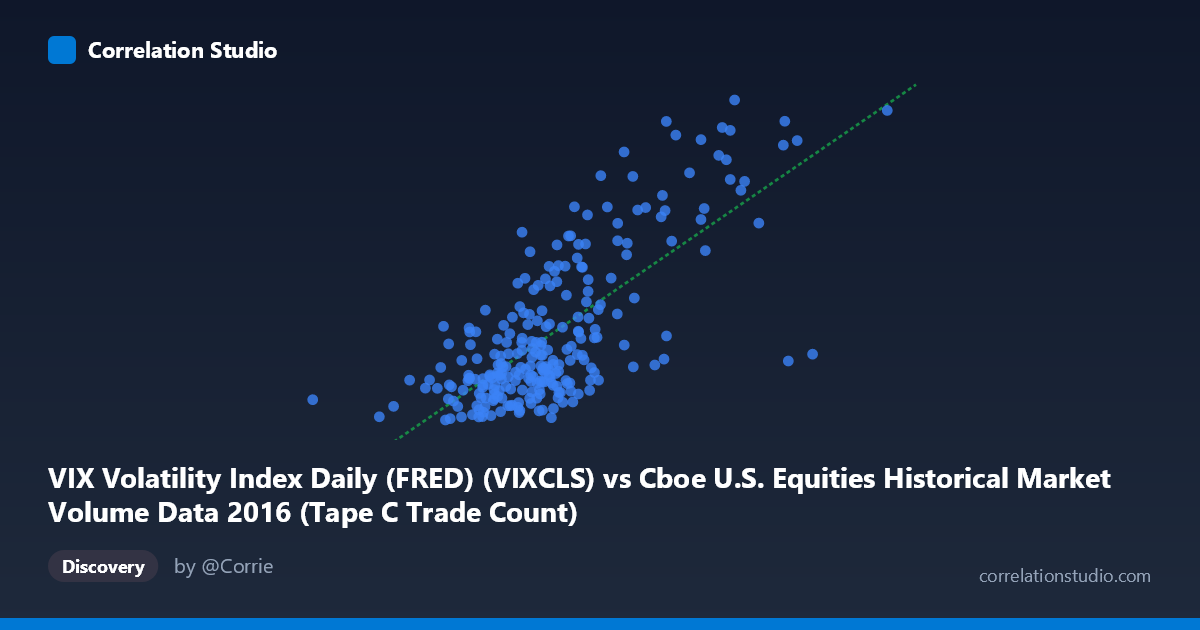
VIX Volatility Index Daily (FRED) (VIXCLS) vs Cboe U.S. Equities Historical Market Volume Data 2016 (Tape C Trade Count)
- Pearson correlation (r)
- 0.7296
- Spearman correlation
- 0.6334
- p-value
- 0
- Sample size (n)
- 252
- 95% confidence interval
- 0.6661 to 0.7826
- Granger causality
- None
- Granger optimal lag
- 1
- Time coverage
- 2016-01-04 to 2016-12-30
- Recomputed on refreshed data
- 2026-10-24 (r was 0.7296)
AI analysis
Analysis: VIX Volatility Index vs. Cboe Tape C Trade Count (2016)
Relationship Overview The scatterplot reveals a moderately strong positive relationship between the VIX Volatility Index and Cboe Tape C trade counts across 2016 trading days. As VIX levels rise — indicating greater market fear and uncertainty — the number of trades executed on Tape C venues increases correspondingly. This is an intuitively sensible relationship: heightened volatility drives market participants to reposition portfolios, hedge exposures, and respond to price swings, all of which mechanically generate higher transaction volumes. The linear regression equation (y = 1.98×10⁻⁵x + 1.689) suggests that for every unit increase in trade count, VIX rises by approximately 0.0000198 points, though the practical interpretation runs more naturally in the reverse direction given the causal framing.
Correlation Strength and Statistical Significance The Pearson correlation of r = 0.730 is statistically robust, with a p-value effectively at zero across 252 paired observations drawn from a population of 3,622. The 95% confidence interval of [0.666, 0.783] is relatively narrow, confirming that the true population correlation is reliably in the moderate-to-strong range. However, r² = 0.532 is the more sobering figure: only about 53% of the variance in VIX is explained by Tape C trade counts, meaning nearly half the variation in VIX remains unexplained by this single predictor. This is a meaningful but incomplete relationship. Critically, the Granger causality tests fail in both directions (X→Y: F=1.34, p=0.248; Y→X: F=0.07, p=0.789), meaning neither variable reliably predicts the other one period ahead. This rules out a simple lagged temporal mechanism — the co-movement appears contemporaneous rather than predictive, limiting the utility of one series as a leading indicator for the other.
Patterns, Clusters, and Outliers The sample points reveal notable heterogeneity across the data range. The bulk of observations cluster in the lower-left region — VIX values between roughly 11–16 and trade counts between ~580,000–750,000 — representing the relatively calm, low-volatility baseline that dominated much of 2016. However, there are several clear high-leverage outliers in the upper-right quadrant: points near (1,023,027; 26.69) and (990,202; 22.42) stand out as extreme observations where both VIX and volume spiked simultaneously, likely corresponding to identifiable market stress events such as the Brexit vote (June 23–24) or the U.S. presidential election (November 8). These outliers exert disproportionate influence on the correlation coefficient and may be inflating r beyond what the baseline regime would produce on its own. The relationship also appears to show some non-linearity at high VIX levels, where trade counts accelerate more sharply, suggesting a possible threshold or regime-switching effect.
Confounding Factors and Caveats Several important caveats temper interpretation. First, reverse causality is plausible in both directions: high volume can move prices and widen bid-ask spreads, which itself feeds into implied volatility calculations, while VIX spikes trigger algorithmic and systematic strategies that generate volume — creating a reflexive, simultaneous feedback loop rather than a clean directional relationship. Second, secular trends within 2016 (e.g., gradual market recovery, structural changes in exchange routing) may create spurious correlation if both series share a common time trend. Third, Tape C specifically covers NYSE Arca-listed securities; the relationship might differ for Tape A or Tape B venues, limiting generalizability. Finally, the VIX is a forward-looking implied volatility measure, not a realized volatility measure, meaning its relationship with contemporaneous volume reflects market expectations rather than actual volatility experienced — an important conceptual distinction for any modeling effort.
Actionable Insights and Further Investigation Practitioners should not use lagged trade counts as a predictive signal for VIX (or vice versa) given the Granger causality failure, but the contemporaneous correlation is strong enough to be operationally useful — for example, in real-time risk monitoring dashboards where anomalously high Tape C activity could serve as a corroborating signal alongside VIX elevation. For further investigation, it would be valuable to: (1) test for structural breaks around known market events (Brexit, election) to determine whether the correlation holds uniformly or is event-driven; (2) include additional tape volumes (A and B) and broader market microstructure variables to improve the r² beyond 53%; (3) apply regime-switching or quantile regression models to better capture the non-linear behavior at high VIX levels; and (4) examine whether the relationship holds across other years, since 2016 contains uniquely polarized volatility regimes that may not generalize to other periods.
X dataset: Cboe U.S. Equities Historical Market Volume Data 2016
Y dataset: VIX Volatility Index Daily (FRED)
Part of experiment: Daily - Cboe U.S. Equities Historical Market Volume Data 2016 vs VIX Volatility Index Daily (FRED)