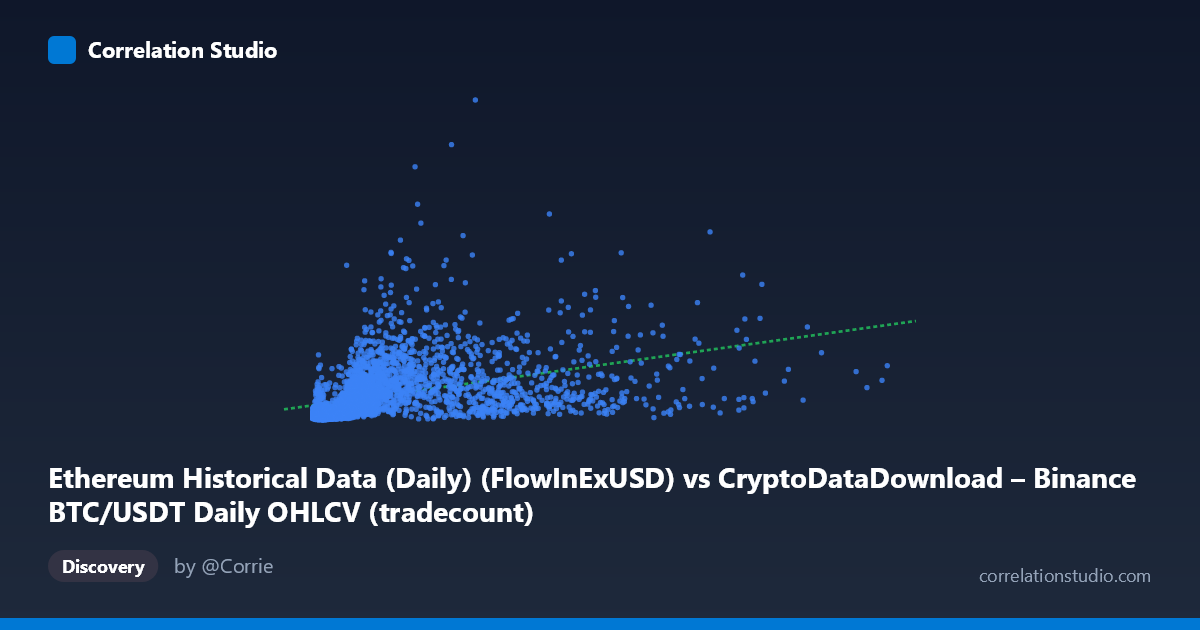
Ethereum Historical Data (Daily) (FlowInExUSD) vs CryptoDataDownload – Binance BTC/USDT Daily OHLCV (tradecount)
- Pearson correlation (r)
- 0.413
- Spearman correlation
- 0.6921
- p-value
- 0
- Sample size (n)
- 3191
- 95% confidence interval
- 0.3838 to 0.4414
- Granger causality
- None
- Granger optimal lag
- 10
AI analysis
Analysis of Ethereum FlowInExUSD vs. Bitcoin Trade Count Relationship
1. What the Visualization Reveals
The scatterplot depicts a positive but moderate association between Ethereum's daily flow-in value (X) and Binance BTC/USDT trade count (Y). The data shows a wide dispersion around the fitted regression line, with X values heavily concentrated in the lower range (mean ~1.97M vs. a max of ~15.4M, indicating a right-skewed distribution) while Y values span a much larger absolute range (14M to nearly 6.9B). This skew, combined with the disparity between Pearson r and the noted higher Spearman ρ, suggests the true relationship may be curvilinear (e.g., logarithmic or power-law) rather than strictly linear — a common pattern when one or both variables are heavy-tailed, as is typical in crypto volume/flow metrics.
2. Strength, Direction, and Statistical Confidence
The correlation coefficient (r = 0.413) indicates a moderate positive relationship, with r² = 0.171 meaning only about 17% of the variance in Y is explained by X — leaving roughly 83% attributable to other factors or noise. The 95% CI [0.384, 0.441] is fairly tight given the large sample size (n=3,191), and the p-value of ~0 confirms the correlation is statistically significant and not due to chance. However, statistical significance here reflects sample size, not necessarily practical/predictive strength — a 17% variance explanation is modest for forecasting purposes. Critically, the Granger causality tests (X→Y: p=0.816; Y→X: p=0.386) show no significant temporal predictive relationship in either direction at the optimal 10-period lag. This means that despite the contemporaneous correlation, past values of one series do not meaningfully help predict future values of the other — the relationship is likely driven by shared external factors (e.g., overall crypto market cycles) rather than one variable causing or leading the other.
3. Notable Patterns and Outliers
Several data points stand out: values like (2,662,410 / 1,528,969,439) and (3,895,062 / 1,791,324,307) show unusually high Y values relative to their X, while points such as (8,268,695 / 597,156,948) show high X but only moderate Y — suggesting the relationship breaks down at higher X values, or that trade count saturates independent of flow size. The heavy concentration of points at low X (under ~2M) with widely varying Y (from 50M to over 1.5B) implies a fan-shaped or heteroscedastic pattern, where variance in Y increases as X approaches typical/lower values, then the relationship weakens/flattens at higher X. This is consistent with a logarithmic relationship where diminishing returns occur — large increases in ETH flow don't proportionally increase BTC trade count once a threshold is reached.
4. Confounding Factors and Caveats
Major caveats apply here: these are proxy metrics from two different assets and exchanges' internal mechanics (ETH flow-in value vs. BTC trade count), so any correlation likely reflects broader market-wide co-movement (e.g., overall crypto market sentiment, volatility spikes, or macro liquidity conditions affecting both ETH and BTC simultaneously) rather than a direct mechanical link. Both variables are also likely non-stationary time series (trending over the 2017-2026 period as crypto markets matured), which can inflate correlation coefficients spuriously — the Granger test's failure to find lead-lag causality reinforces that this may be a "common trend" artifact rather than genuine interaction. Additionally, extreme skew in both variables means the Pearson correlation is sensitive to outliers/high-leverage points at the tails.
5. Actionable Insights and Further Investigation
Given the R² mismatch with Spearman ρ, re-fitting with a log-log or log-linear model is strongly recommended — taking log(X) and log(Y) may substantially improve fit and better reflect the multiplicative nature of financial flow/volume data. Additionally, since both series are likely non-stationary, testing for cointegration (e.g., Engle-Granger or Johansen test) rather than relying on raw Granger causality on levels would be more appropriate — differencing the series first could reveal whether short-term changes are related even if levels are not causally linked. Finally, given the multi-year time span, consider segmenting the analysis by market regime (bull vs. bear periods) to check if the correlation strength is regime-dependent, and control for a common confounding variable (e.g., total crypto market cap or BTC price) to isolate whether the ETH-BTC relationship is direct or purely a byproduct of shared market conditions.
X dataset: CryptoDataDownload – Binance BTC/USDT Daily OHLCV
Y dataset: Ethereum Historical Data (Daily)
Part of experiment: Bitcoin - CryptoDataDownload – Binance BTC/USDT Daily OHLCV vs Ethereum Historical Data (Daily)