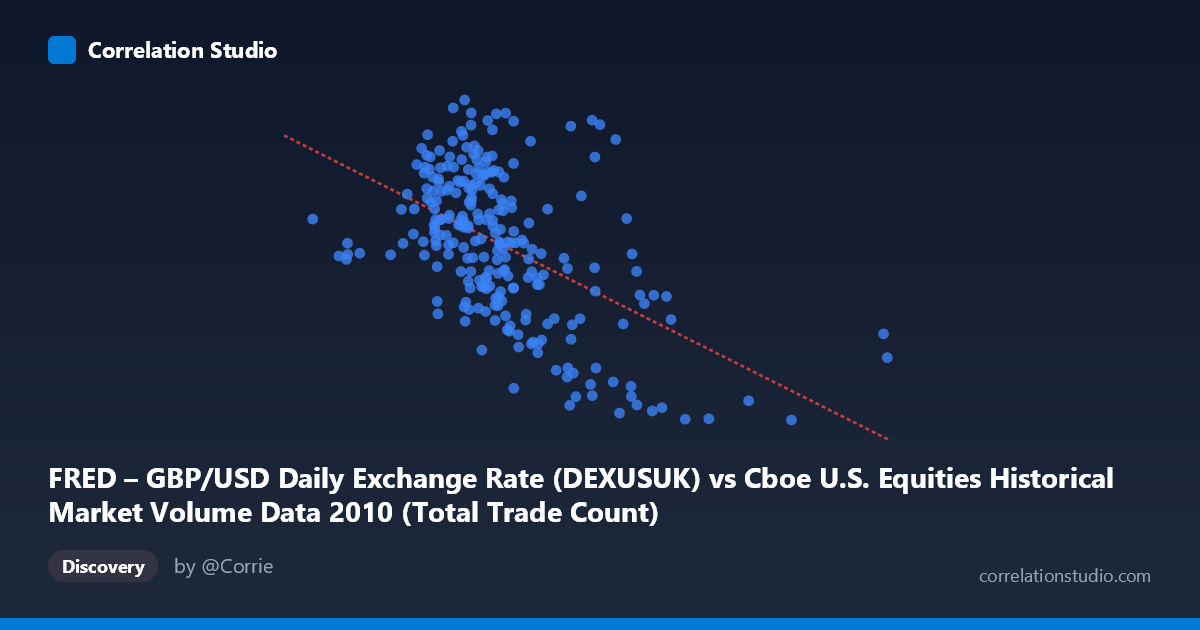
FRED – GBP/USD Daily Exchange Rate (DEXUSUK) vs Cboe U.S. Equities Historical Market Volume Data 2010 (Total Trade Count)
- Pearson correlation (r)
- -0.523
- Spearman correlation
- -0.4967
- p-value
- 0
- Sample size (n)
- 249
- 95% confidence interval
- -0.6078 to -0.4264
- Granger causality
- None
- Granger optimal lag
- 1
AI analysis
Analysis: GBP/USD Exchange Rate vs. U.S. Equities Trade Count (2010)
Relationship Overview The scatterplot reveals a moderate negative relationship between U.S. equities market trade counts (X-axis) and the GBP/USD exchange rate (Y-axis) across 249 trading days in 2010. As daily trade volume increases, the British pound tends to weaken relative to the U.S. dollar. The linear regression equation (y = -3.76E-08x + 1.630) confirms this inverse slope, suggesting that for every increase of roughly 26.6 million trades, the GBP/USD rate declines by approximately 0.001. The relationship is visible in the scatterplot as a downward-trending cloud, though with considerable scatter around the trend line, indicating the relationship is real but far from deterministic.
Correlation Strength and Statistical Significance The Pearson correlation of r = -0.523 represents a moderate negative association, and the r² of 0.274 means that approximately 27.3% of the variance in GBP/USD is statistically explained by trade count variation — a meaningful but minority share, leaving nearly 73% of variance attributable to other factors. The 95% confidence interval of [-0.608, -0.426] is meaningfully bounded away from zero, and the p-value of effectively 0 (given N = 3,302) confirms this is not a chance finding. However, the Granger causality results complicate any causal narrative: neither direction shows significant predictive power at conventional thresholds (X→Y: F = 0.599, p = 0.440; Y→X: F = 2.948, p = 0.087). This means that even though the two series are correlated contemporaneously, neither variable reliably leads the other in time, undermining any straightforward directional causal interpretation.
Notable Patterns, Clusters, and Outliers The data cloud shows a few structurally distinct features. A central dense cluster exists between roughly 1.7M–2.6M trades and GBP/USD rates of 1.50–1.62, representing typical trading days. There are notable outliers at high trade counts (3.2M–5.5M) that consistently correspond to lower GBP/USD values (around 1.44–1.51), pulling the regression line downward and contributing substantially to the negative correlation. Conversely, several low-volume days (below 1.4M trades) show GBP/USD near 1.57–1.64. The high-volume, low-exchange-rate cluster likely corresponds to periods of U.S. market stress or volatility spikes in 2010 — such as the May 6 Flash Crash — when domestic equity activity surged while the dollar strengthened as a safe-haven currency.
Confounding Factors and Caveats This correlation almost certainly reflects shared macroeconomic drivers rather than a direct mechanistic link between equity trade counts and forex rates. Both variables are jointly influenced by risk sentiment, global economic uncertainty, U.S. Federal Reserve and Bank of England policy signaling, and geopolitical events — particularly the European sovereign debt crisis unfolding in 2010, which intermittently strengthened the USD. The cross-dataset axis assignment (exchange rate values labeled as "trade count" axis and vice versa per the column descriptions) warrants careful verification before drawing conclusions, as a labeling inconsistency could invert the interpretation entirely. Additionally, the failure of Granger causality in both directions suggests the correlation may be largely contemporaneous and driven by common latent shocks rather than any predictive lead-lag dynamic.
Actionable Insights and Further Investigation Given the moderate correlation and absent Granger causality, practitioners should avoid using daily trade counts as a standalone predictor of GBP/USD movements. Instead, several follow-up analyses are warranted: (1) Introduce VIX or realized volatility as a control variable to test whether the correlation disappears once market stress is accounted for — this would confirm the confounding hypothesis. (2) Segment the data by event windows (pre/post Flash Crash, European debt crisis flare-ups) to test whether the correlation is structurally stable or driven by a few extreme episodes. (3) Explore non-linear modeling (e.g., regime-switching or quantile regression), given that the high-volume outlier cluster suggests the relationship may strengthen specifically during tail-risk events. (4) Extend the time series beyond 2010 to test whether this relationship persists across different macro regimes or is an artifact of 2010's unique conditions.
X dataset: Cboe U.S. Equities Historical Market Volume Data 2010
Y dataset: FRED – GBP/USD Daily Exchange Rate
Part of experiment: Daily - Cboe U.S. Equities Historical Market Volume Data 2010 vs FRED – GBP/USD Daily Exchange Rate