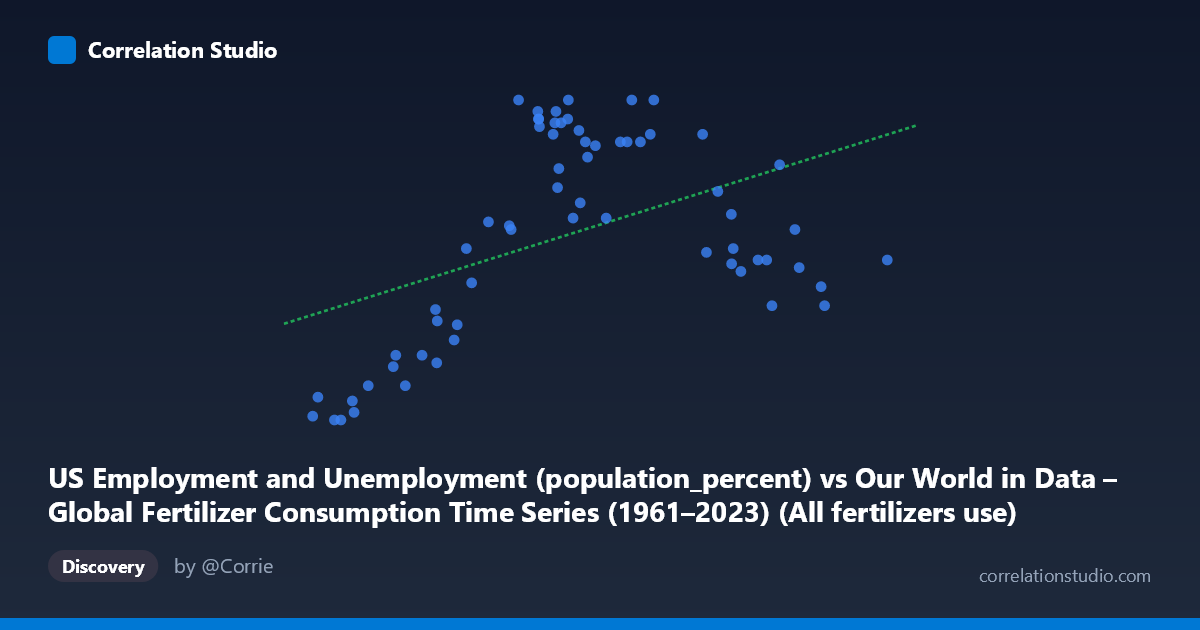
US Employment and Unemployment (population_percent) vs Our World in Data – Global Fertilizer Consumption Time Series (1961–2023) (All fertilizers use)
- Pearson correlation (r)
- 0.4477
- Spearman correlation
- 0.3875
- p-value
- 0.000234
- Sample size (n)
- 63
- 95% confidence interval
- 0.2249 to 0.626
- Granger causality
- None
- Granger optimal lag
- 1
AI analysis
Scatterplot Analysis: US Employment Rate vs. Global Fertilizer Consumption
1. Overall Relationship The scatterplot reveals a moderate positive association between US employment population percentage (X-axis) and global all-fertilizer use (Y-axis), spanning data from 1961 to 2023. As US employment rates rise, global fertilizer consumption tends to increase as well. The linear regression equation (y = 2.41×10⁻⁷x + 60.7) confirms this upward trend, though the scatter around the regression line is substantial, indicating that the relationship is far from deterministic. Visually, the data appear to form a broad, loosely defined cloud with a gentle positive slope rather than a tight linear band.
2. Correlation Strength, Direction, and Temporal Causality The Pearson correlation of r = 0.4477 indicates a moderate positive relationship, but the explanatory power is limited: r² = 0.2004 means only ~20% of the variance in global fertilizer use is explained by US employment rates, leaving 80% attributable to other factors. The 95% confidence interval of [0.2249, 0.6260] is relatively wide, reflecting meaningful uncertainty in the true population correlation, though the statistically significant p-value of 0.0002 confirms this is unlikely to be a chance finding at conventional thresholds. Critically, Granger causality analysis finds no significant predictive direction in either direction — neither X→Y (F=0.019, p=0.891) nor Y→X (F=1.674, p=0.201) — meaning that past values of one variable do not meaningfully help forecast the other. This is an important caution against any causal or even predictive interpretation of the correlation.
3. Notable Patterns, Clusters, and Outliers The data exhibit a degree of clustering that hints at non-linearity or regime changes over time. Lower X values (employment rates roughly 3–7 million population percent) cluster at lower Y values (58–62), while mid-to-high X values (10–16 million) span a wide Y range (63–67), suggesting a possible saturation effect at higher employment levels. Several points at high X values (18–23 million) show declining or flat Y values (61–65), creating a right-side downturn that disrupts the linear trend — this is consistent with late-period data where global fertilizer use may have plateaued. Points like (3,156,855; 58.8) and (22,747,429; 62.9) sit at the extremes of X but do not represent dramatic Y outliers, suggesting no single observation is dominating the correlation unduly.
4. Confounding Factors and Interpretive Caveats This correlation is highly susceptible to shared secular time trends — both global fertilizer consumption and US employment have generally grown over the post-war decades, meaning the observed correlation may largely reflect parallel long-run growth rather than any genuine functional link. This is a classic spurious correlation driven by a common temporal trend (economic development, population growth, post-WWII industrialization). Additionally, the datasets come from fundamentally different domains — one is a US labor market indicator, the other a global agricultural metric — making any mechanistic link implausible without a well-theorized pathway. The dataset note mismatches (X-axis label references fertilizer data but is described as employment; Y-axis is reversed) also warrant data-labeling verification before drawing conclusions.
5. Actionable Insights and Further Investigation Given the absence of Granger causality and the likely spuriousness of the correlation, no predictive or policy-relevant link should be assumed between these variables. Future investigation should: (1) detrend both series (e.g., using first-differences or filtering) to test whether any residual correlation persists after removing shared secular trends; (2) explore whether a common driver such as global GDP, population, or post-war economic expansion explains both variables simultaneously; (3) investigate the nonlinear pattern in the high-X range by segmenting data into pre- and post-1990 periods, where fertilizer use dynamics changed substantially; and (4) correct and verify the axis labeling discrepancy in the dataset metadata before publishing or acting on these results.
X dataset: Our World in Data – Global Fertilizer Consumption Time Series (1961–2023)
Y dataset: US Employment and Unemployment
Part of experiment: Yearly - Our World in Data – Global Fertilizer Consumption Time Series (1961–2023) vs US Employment and Unemployment