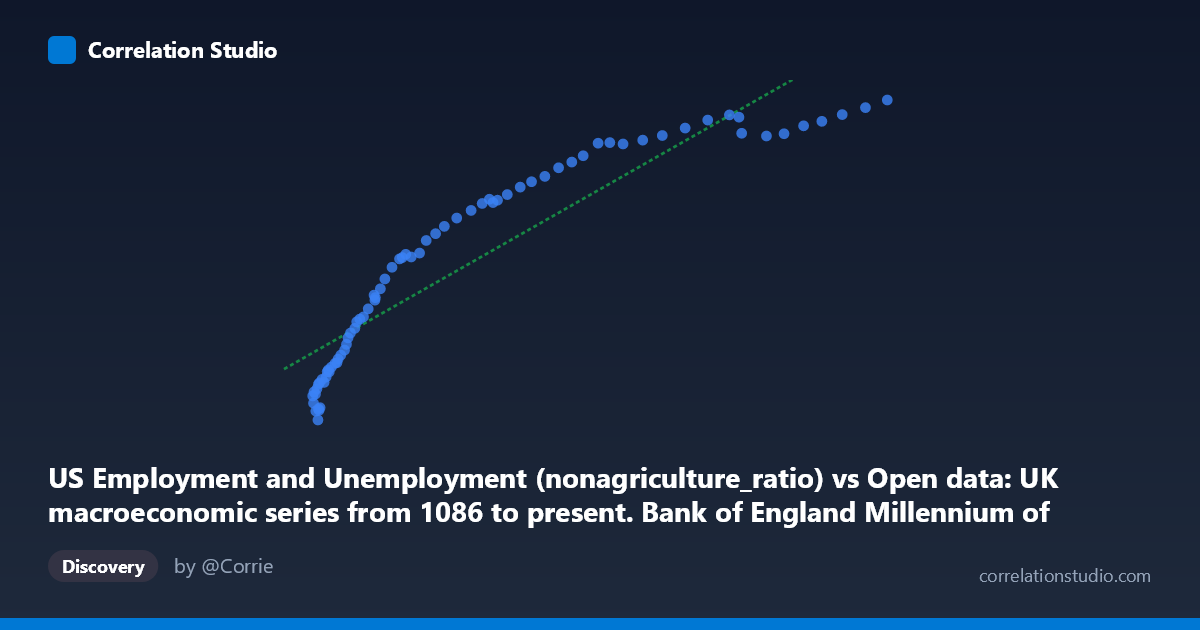
US Employment and Unemployment (nonagriculture_ratio) vs Open data: UK macroeconomic series from 1086 to present. Bank of England Millennium of Macroeconomic Data. (Year) (value)
- Pearson correlation (r)
- 0.9196
- Spearman correlation
- 0.9932
- p-value
- 0
- Sample size (n)
- 76
- 95% confidence interval
- 0.8757 to 0.9484
- Granger causality
- None
- Granger optimal lag
- 10
AI analysis
Analysis of US Non-Agricultural Employment Ratio vs. UK Macroeconomic Index
Relationship Overview The scatterplot reveals a strong positive relationship between the US non-agricultural employment ratio and the UK macroeconomic index value, with both variables trending upward together across the 1941–2016 observation window. The linear regression equation (y = 0.2529x + 55,451) suggests that for every unit increase in the US employment ratio measure, the UK index rises by approximately 0.25 units, anchored to a substantial baseline intercept. Visually, the data points follow a broadly coherent upward arc, though the relationship appears to exhibit mild nonlinearity — particularly at higher X values where the curve begins to flatten, suggesting diminishing returns or saturation in the UK series as US employment reaches its upper range.
Correlation Strength and Statistical Framing The Pearson correlation of r = 0.92 is statistically strong, and the R² of 0.846 means approximately 84.6% of the variance in the UK macroeconomic index is statistically explained by the US employment ratio — a remarkably high figure for cross-national economic data. The 95% confidence interval [0.876, 0.948] is narrow and entirely positive, confirming that this association is robust and not an artifact of sampling variability. The p-value of effectively zero further eliminates chance as an explanation. However, the Granger causality tests tell a critically different story: neither direction (X→Y: F=1.11, p=0.379; Y→X: F=1.11, p=0.373) achieves significance even at a 10-period lag, meaning that neither series temporally predicts the other beyond what each already contains in its own history. This is a crucial distinction — high correlation does not imply temporal predictive power here.
Patterns, Clusters, and Nonlinearity The data loosely cluster into three regions: a dense lower-left cluster (X < ~100,000, Y < ~100,000) representing earlier decades with lower employment ratios and lower UK index values; a sparse middle range; and a more dispersed upper-right grouping at higher values. The upper-right region (X ~350,000) shows notable horizontal compression in Y — several high-X observations yield Y values that plateau between ~136,000–149,000 — reinforcing the nonlinear, concave character of the true relationship. A logarithmic or square-root transformation of X would likely improve fit. No extreme isolated outliers are apparent, though the highest X values (e.g., 468,775 / 148,976 and 452,250 / 146,411) sit at the frontier of the observed range and warrant scrutiny.
Confounding Factors and Caveats The most important caveat is that both series are almost certainly driven by a common underlying factor: secular time trends. Global economic growth, post-WWII industrialization, demographic expansion, and technological advancement all simultaneously drove US employment and UK economic aggregates upward over 1941–2016. This creates a classic spurious correlation through shared temporal trend — two independently rising series will correlate strongly even with no causal mechanism linking them. The absence of Granger causality supports this interpretation. Additionally, the datasets originate from entirely different institutional sources (BLS vs. Bank of England), measured in incompatible units, which further undermines causal interpretation. Structural breaks (oil shocks, 2008 financial crisis, early Cold War period) may distort the relationship in ways the linear model masks.
Actionable Insights and Further Investigation Given the nonlinearity visible at high X values, fitting a logarithmic or piecewise regression would likely yield a better-specified model. More importantly, researchers should detrend both series (e.g., via first-differencing or HP filtering) before reassessing correlation — if the association survives detrending, it would constitute meaningfully stronger evidence of a real structural link. Extending the Granger causality test across a range of shorter lags (1–5 periods) rather than relying solely on the optimal 10-period lag may also reveal shorter-horizon predictive dynamics. Finally, introducing confound controls such as global GDP growth, trade openness, or shared monetary conditions would help isolate whether any residual co-movement reflects genuine US–UK labor market integration or remains entirely trend-driven.
X dataset: Open data: UK macroeconomic series from 1086 to present. Bank of England Millennium of Macroeconomic Data. (Year)
Y dataset: US Employment and Unemployment
Part of experiment: Yearly - Open data: UK macroeconomic series from 1086 to present. Bank of England Millennium of Macroeconomic Data. (Year) vs US Employment and Unemployment