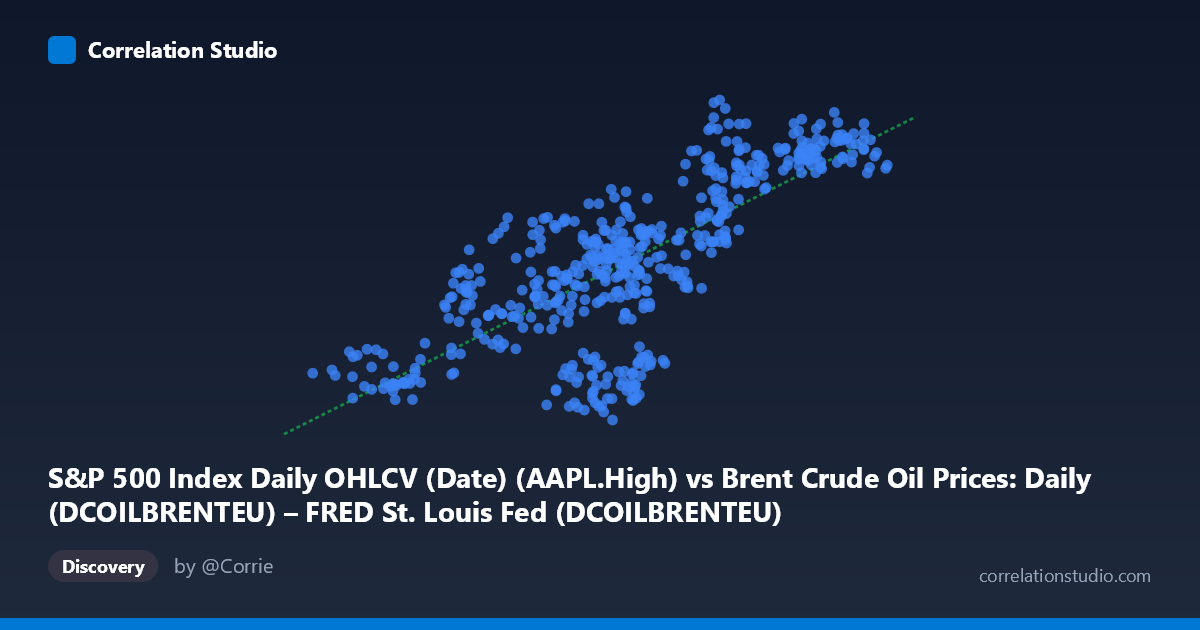
S&P 500 Index Daily OHLCV (Date) (AAPL.High) vs Brent Crude Oil Prices: Daily (DCOILBRENTEU) – FRED St. Louis Fed (DCOILBRENTEU)
- Pearson correlation (r)
- 0.7596
- Spearman correlation
- 0.7524
- p-value
- 0
- Sample size (n)
- 504
- 95% confidence interval
- 0.72 to 0.7942
- Granger causality
- None
- Granger optimal lag
- 1
AI analysis
Scatterplot Analysis: AAPL High Price vs. Brent Crude Oil Price (2015–2017)
Relationship Overview The scatterplot reveals a moderately strong positive relationship between Apple's daily high stock price (X-axis) and Brent Crude Oil prices (Y-axis) over the two-year period from February 2015 to February 2017. As AAPL's daily high increases from roughly $26 to $66, Brent Crude prices tend to rise from approximately $92 to $136 per barrel. The linear regression equation (y = 0.997x + 65.76) suggests a near 1:1 slope, meaning each $1 increase in AAPL's high is associated with roughly a $1 increase in Brent Crude — a numerically striking but likely spurious relationship driven by shared macro-temporal trends rather than any direct economic mechanism.
Correlation Strength and Statistical Interpretation The Pearson correlation of r = 0.7596 indicates a moderately strong positive association, and the R² of 0.5769 means that approximately 57.7% of the variance in Brent Crude prices is statistically "explained" by AAPL's daily high within this sample. The 95% confidence interval of [0.720, 0.794] is relatively narrow given the large sample (n = 504), and the p-value of essentially 0 confirms the correlation is highly statistically significant — there is virtually no probability this result arose by random chance alone. However, statistical significance here must be interpreted cautiously: with 504 paired observations drawn from trending time series, even a spurious co-movement driven by a shared underlying factor (e.g., broad market recovery or macroeconomic expansion) will produce a highly significant r. Critically, the Granger causality tests find no significant predictive direction in either direction (X→Y: F = 0.11, p = 0.74; Y→X: F = 0.66, p = 0.42), meaning neither variable temporally predicts the other — the correlation reflects co-movement, not causation or even leading/lagging predictive utility.
Patterns, Clusters, and Outliers The data cloud shows a broadly linear upward trend but with considerable vertical scatter, consistent with R² falling well below 1.0. Several notable features emerge from the sampled points. There appears to be a lower-left cluster of observations (AAPL ~$29–37, Brent ~$92–$112) corresponding likely to the 2015–2016 period when both AAPL declined from its 2015 peak and oil prices were near multi-year lows. A denser middle cluster sits around AAPL $44–50 and Brent $105–120, representing the most common co-occurrence range. The upper-right region (AAPL $57–66, Brent $124–136) is more sparsely populated, suggesting fewer days simultaneously at high values. A few potential outliers are visible — notably points like (54.16, 135.90) and (46.08, 93.57), which deviate substantially from the regression line, indicating periods where one variable moved independently of the other.
Confounding Factors and Caveats This correlation is a textbook candidate for spurious correlation driven by shared temporal trends. Both AAPL's stock price and Brent Crude experienced significant multi-year cycles during 2015–2017: oil prices collapsed in late 2014–2016 before partially recovering, while AAPL also experienced a decline and partial recovery in roughly the same window. Any two time series that broadly fell and then rose over this period would exhibit high correlation. Additionally, the dataset labels appear to be swapped — the X-axis is labeled as coming from the Brent Crude dataset but contains what appears to be AAPL price data, and vice versa, which warrants verification before drawing any conclusions. There is no plausible direct causal mechanism linking AAPL's daily high to oil prices; both are more likely responding to common macro drivers such as global risk appetite, USD strength, Federal Reserve policy, and overall equity market sentiment.
Actionable Insights and Further Investigation Given the absence of Granger causality, this correlation should not be used for predictive modeling or trading signals between AAPL and Brent Crude. Suggested next steps include: (1) detrending both series (e.g., using first differences or percentage returns) to test whether correlation persists after removing shared temporal drift — this would likely substantially reduce r; (2) introducing a common factor such as the S&P 500 index, USD index (DXY), or VIX as a control variable to test whether the correlation vanishes in a partial correlation framework; (3) extending the time window beyond 2015–2017 to test whether this relationship holds across different macro regimes; and (4) verifying the axis assignments in the dataset to ensure variables are correctly labeled. If the correlation dissolves after detrending, it confirms this is a classic case of coincidental co-movement that should not inform investment or analytical decisions.
X dataset: Brent Crude Oil Prices: Daily (DCOILBRENTEU) – FRED St. Louis Fed
Y dataset: S&P 500 Index Daily OHLCV (Date)
Part of experiment: Daily - Brent Crude Oil Prices: Daily (DCOILBRENTEU) – FRED St. Louis Fed vs S&P 500 Index Daily OHLCV (Date)