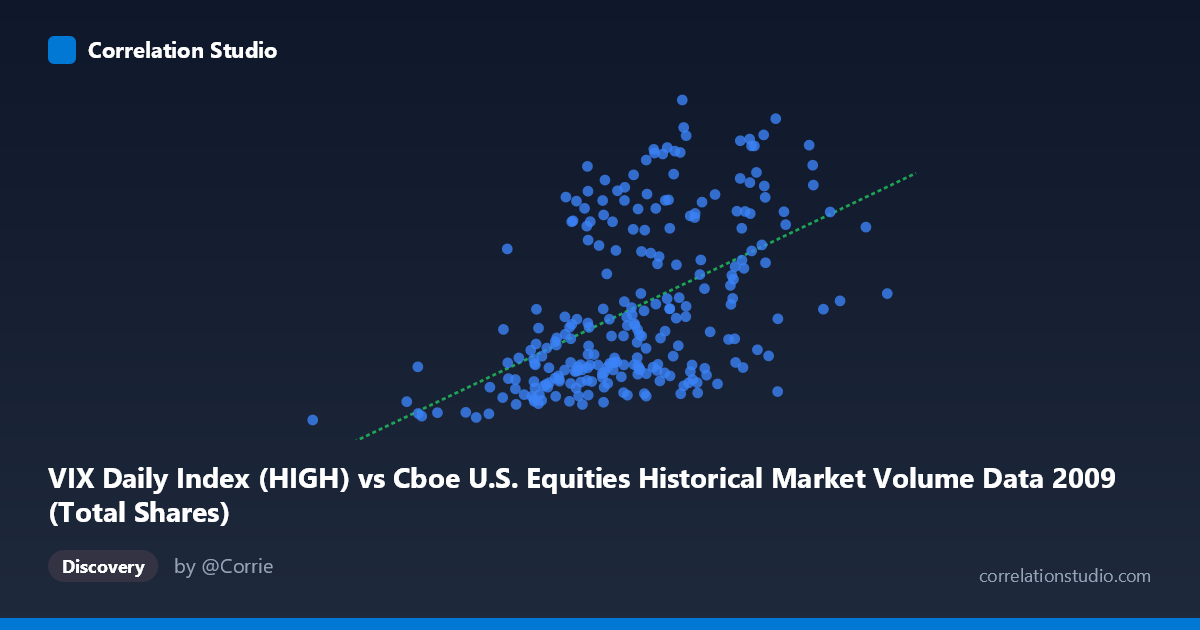
VIX Daily Index (HIGH) vs Cboe U.S. Equities Historical Market Volume Data 2009 (Total Shares)
- Pearson correlation (r)
- 0.5127
- Spearman correlation
- 0.5399
- p-value
- 0
- Sample size (n)
- 252
- 95% confidence interval
- 0.4155 to 0.5984
- Granger causality
- None
- Granger optimal lag
- 1
AI analysis
Scatterplot Analysis: VIX Daily Index (HIGH) vs. Total Shares Traded (2009)
Overall Relationship The scatterplot reveals a moderate positive relationship between the VIX Daily Index High values and total shares traded on U.S. equities exchanges throughout 2009. As the VIX High increases — indicating elevated market fear or uncertainty — total share volume tends to rise alongside it. This is broadly consistent with well-established market behavior: volatility spikes typically coincide with heightened trading activity as investors react to uncertainty by repositioning portfolios. The linear regression equation (y = 3.17 × 10⁻⁸x + 8.68) confirms the positive slope, though the relatively modest coefficient suggests the relationship, while real, is far from deterministic.
Correlation Strength and Statistical Significance The Pearson correlation of r = 0.51 indicates a moderate positive association, but the explanatory power is considerably more limited than the headline figure might suggest. With r² = 0.263, only about 26.3% of the variance in total shares traded is explained by the VIX High — meaning roughly three-quarters of the variation in trading volume stems from factors entirely unrelated to volatility as captured here. The 95% confidence interval of [0.42, 0.60] is meaningfully above zero and relatively tight given n = 252, and the p-value of effectively zero confirms this correlation is highly unlikely to be a chance artifact in this sample. That said, the Granger causality tests tell an important complementary story: neither direction of temporal predictive causality is statistically significant (X→Y: F = 0.52, p = 0.47; Y→X: F = 1.33, p = 0.25). This means that while the two variables move together contemporaneously, knowing today's VIX High does not reliably predict tomorrow's trading volume, and vice versa — a critical distinction between correlation and actionable temporal forecasting.
Patterns, Clusters, and Outliers The sample points reveal notable heterogeneity across the data. There is a visible clustering of observations in the lower-left quadrant — VIX values roughly below 35 and lower share volumes — which likely corresponds to the relative market stabilization in the second half of 2009 as conditions normalized post-crisis. A second, more dispersed cluster sits at higher VIX readings (roughly 40–55), with several high-volume outliers that pull the regression line upward. The point near (192M, 19.67) stands out as an extreme low-end anchor, while observations exceeding 1.1 billion in the X variable with VIX readings above 45 represent the opposite tail, likely reflecting the elevated volatility of early-to-mid 2009. The spread around the regression line widens noticeably at higher VIX values, suggesting heteroscedasticity — the relationship becomes less predictable precisely when volatility is most extreme.
Confounding Factors and Caveats Several important caveats temper interpretation. First, 2009 is an exceptional year — spanning the tail end of the 2008 financial crisis and a historic market recovery — meaning this correlation may not generalize to normal market conditions. The volatility-volume relationship observed here is likely amplified by crisis-era dynamics. Second, the dataset conflates all U.S. equities exchanges and TRFs, which may mask compositional shifts in where trading occurs versus how much occurs. Third, the axes appear to be swapped from their intuitive roles (VIX is plotted on X despite being labeled as a Y-axis dataset, and vice versa), warranting careful verification of data alignment. Finally, omitted variables such as Federal Reserve interventions, earnings seasons, index rebalancing events, and macroeconomic announcements almost certainly explain much of the residual 73.7% variance.
Actionable Insights and Further Investigation Practitioners should avoid using daily VIX High readings as a standalone predictor of trading volume given the weak Granger causality results and the substantial unexplained variance. Instead, this relationship is better framed as a coincident indicator — useful for contextualizing why volume is elevated on a given day, not for forecasting tomorrow's activity. Further investigation should include: (1) testing non-linear model fits (e.g., logarithmic or polynomial), as the heteroscedastic spread hints at diminishing returns at high volatility levels; (2) segmenting the analysis by market regime (crisis period Q1–Q2 vs. recovery Q3–Q4) to test whether the correlation holds uniformly; (3) incorporating lagged variables beyond one period; and (4) controlling for known confounders such as options expiration dates, macroeconomic data releases, and Federal Open Market Committee announcement days to isolate a cleaner volatility-volume signal.
X dataset: Cboe U.S. Equities Historical Market Volume Data 2009
Y dataset: VIX Daily Index
Part of experiment: Daily - Cboe U.S. Equities Historical Market Volume Data 2009 vs VIX Daily Index