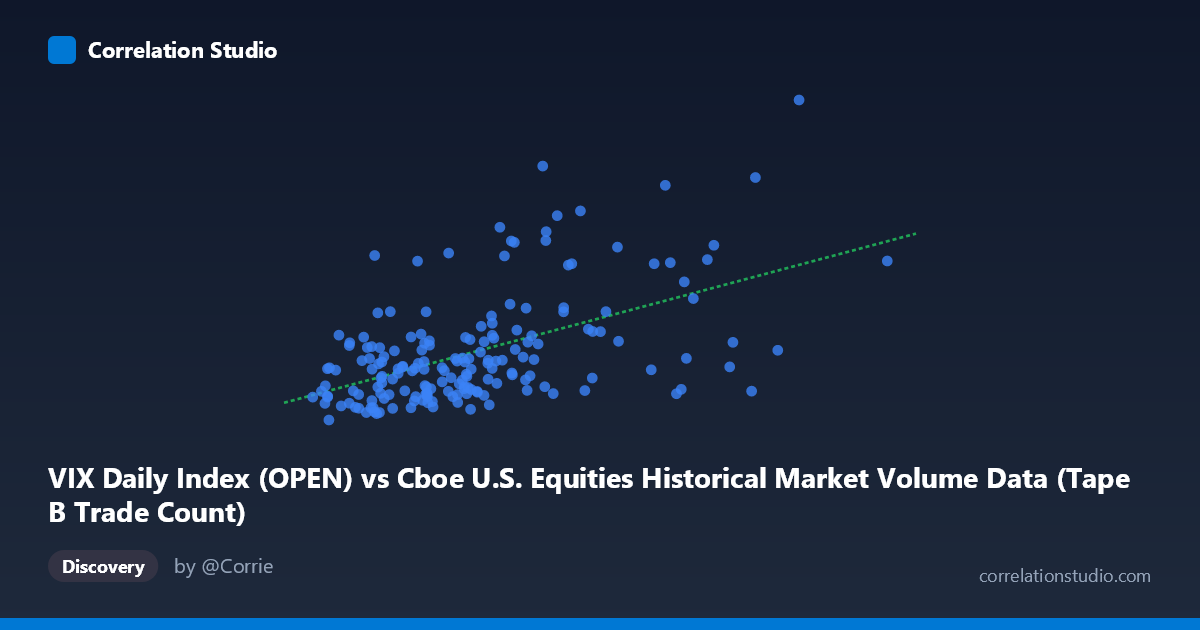
VIX Daily Index (OPEN) vs Cboe U.S. Equities Historical Market Volume Data (Tape B Trade Count)
- Pearson correlation (r)
- 0.5267
- Spearman correlation
- 0.486
- p-value
- 0
- Sample size (n)
- 181
- 95% confidence interval
- 0.4126 to 0.6246
- Granger causality
- None
- Granger optimal lag
- 1
AI analysis
Scatterplot Analysis: VIX Daily Index (OPEN) vs. Tape B Trade Count
Relationship Overview The scatterplot reveals a modest positive relationship between the VIX Daily Index open values and Cboe U.S. Equities Tape B Trade Count over the period January–May 2026. As market volatility (VIX) increases, Tape B trade counts tend to rise as well, consistent with the well-established intuition that elevated volatility environments attract greater trading activity. However, the relationship is visually noisy, with considerable scatter around the regression line (y = 7.47×10⁻⁶x + 12.64), indicating that VIX alone is far from a complete predictor of trade volume behavior.
Correlation Strength and Statistical Significance The Pearson correlation of r = 0.4512 reflects a moderate positive association, but the explanatory power is limited: R² = 0.2036, meaning VIX open values account for only about 20.4% of the variance in Tape B Trade Count. Roughly 80% of the variation in trade counts is driven by factors not captured here. The 95% confidence interval of [0.2786, 0.5956] is meaningfully above zero, and the p-value of 2.77×10⁻⁶ confirms the correlation is highly statistically significant given n = 99 paired observations. Nevertheless, statistical significance should not be conflated with practical magnitude — the moderate R² tempers enthusiasm about VIX as a standalone predictor. Critically, Granger causality tests find no significant directional predictive relationship in either direction (X→Y: F = 0.834, p = 0.363; Y→X: F = 0.041, p = 0.839), suggesting that past VIX values do not reliably forecast future Tape B trade counts (and vice versa) at a 1-period lag. The correlation may reflect contemporaneous co-movement rather than a lead-lag dynamic.
Notable Patterns, Clusters, and Outliers The data exhibits notable clustering at lower VIX values (roughly 650,000–1,050,000 on the X-axis), where trade counts span a wide range from approximately 14.85 to 26, suggesting high variability in trading activity even during relatively calm volatility regimes. Several prominent outliers warrant attention: the point near (1,623,470, 35.12) represents the highest trade count in the sample and aligns with an elevated VIX, while (1,531,753, 30.04) and (1,342,475, 29.53) also sit well above the regression line in the upper-right region. Conversely, points like (1,478,823, 17.63) and (1,523,838, 16.04) suggest that high VIX does not guarantee elevated trade counts, indicating potential non-linearity or threshold effects. The distribution of X values is right-skewed, and there may be a slight non-linear (perhaps quadratic) component to the relationship.
Confounding Factors and Caveats Several important caveats apply. First, the axis labels appear to be swapped in the dataset metadata — the X-axis references "VIX Daily Index (OPEN)" but is sourced from the market volume dataset, while the Y-axis references "Tape B Trade Count" but is sourced from the VIX dataset. This inversion should be carefully verified before drawing substantive conclusions. Second, the time window (January–May 2026) is narrow and may capture idiosyncratic market episodes rather than a generalizable relationship. Third, confounders such as broader market regime shifts, earnings seasons, macroeconomic announcements, or structural changes in market microstructure could independently drive both VIX and trade counts, inflating the observed correlation. The population size of N = 1,980 versus the sample of n = 99 also suggests subsampling that could introduce selection effects.
Actionable Insights and Further Investigation Given the moderate correlation and absence of Granger causality, practitioners should avoid using VIX as a standalone leading indicator for Tape B trade volume forecasting. Instead, further investigation should explore: (1) extending the time series beyond the five-month window to test stability across different volatility regimes; (2) testing non-linear model specifications (e.g., polynomial or spline regression) given the apparent threshold behavior at higher VIX levels; (3) incorporating additional predictors such as Tape A/C volumes, S&P 500 returns, or macroeconomic surprise indices to improve explanatory power; and (4) verifying and correcting the apparent dataset axis attribution issue before publishing or acting on these findings. A rolling-window correlation analysis would also help determine whether the VIX–volume relationship is stable over time or episodic.
X dataset: Cboe U.S. Equities Historical Market Volume Data
Y dataset: VIX Daily Index
Part of experiment: Daily - Cboe U.S. Equities Historical Market Volume Data vs VIX Daily Index