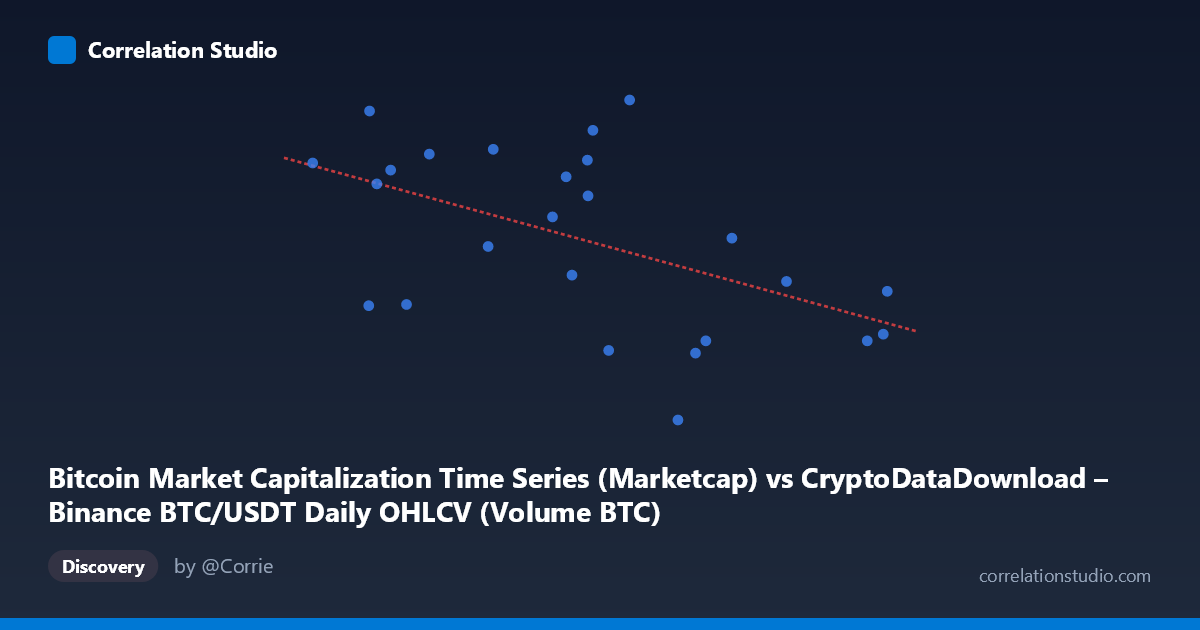
Bitcoin Market Capitalization Time Series (Marketcap) vs CryptoDataDownload – Binance BTC/USDT Daily OHLCV (Volume BTC)
- Pearson correlation (r)
- -0.5184
- Spearman correlation
- -0.4769
- p-value
- 0.007939
- Sample size (n)
- 25
- 95% confidence interval
- -0.7582 to -0.155
- Granger causality
- None
- Granger optimal lag
- 6
AI analysis
Analysis: Bitcoin Market Cap vs. Volume (BTC/USDT Binance)
1. Overall Relationship
The scatterplot depicts a moderate negative relationship between Bitcoin market capitalization (X) and trading volume in BTC (Y) across 25 daily observations from late March to late April 2024. As market cap increases, volume tends to decrease, though the relationship is far from tight or deterministic — points are widely scattered around the downward-sloping regression line, with substantial vertical spread at nearly every X value.
2. Strength, Direction, and Statistical Confidence
The correlation coefficient (r = -0.5184) indicates a moderate negative linear association, but r² = 0.2687 reveals that market cap explains only about 27% of the variance in trading volume — leaving nearly three-quarters of the variation attributable to other factors. The 95% confidence interval [-0.7582, -0.1550] is wide and entirely negative, suggesting the negative direction is likely real, but the true strength could range from weak to fairly strong. With p = 0.0079, the result is statistically significant at conventional thresholds, meaning this pattern is unlikely to be pure noise given the sample. However, statistical significance with n=25 should be interpreted cautiously — it confirms a relationship exists, not that it's practically strong or stable.
Critically, the Granger causality tests show no significant predictive direction in either direction (X→Y: p=0.72; Y→X: p=0.76) at the optimal lag of 6 periods. This means neither variable's past values help forecast the other's future values in a time-series sense. The contemporaneous correlation may reflect a shared underlying driver (e.g., overall market sentiment or price momentum) rather than one variable causing or leading the other.
3. Patterns and Outliers
The data shows a cluster of high market cap (~65,000-72,000) paired with consistently lower volumes (~1.26-1.29 trillion), suggesting that as BTC/USDT pricing pushed market cap higher, trading activity cooled — possibly consistent with reduced volatility or profit-taking phases. Conversely, several low market cap points (~13,000-25,000) show elevated Y-values (~1.35-1.40 trillion), though this range also contains some scatter (e.g., one point near 20,134 with Y=1,356 billion vs. another near 19,316 with Y=1,279 billion), indicating inconsistency. No clear non-linear curvature or distinct sub-clusters are evident; the relationship appears roughly linear but noisy, without obvious outliers dominating the trend.
4. Caveats and Confounders
Several caveats limit interpretation. First, the small sample (n=25, ~3.5 weeks) captures a narrow time window and may not generalize to longer-term BTC market dynamics. Second, both variables are derived from the same underlying price/volume mechanics (market cap = price × supply; volume figures often correlate with price swings), raising concerns about spurious or mechanical correlation rather than independent economic relationship. Third, external factors like macroeconomic news, regulatory announcements, exchange-specific liquidity events, or derivative market activity could be driving both variables simultaneously without being captured here.
5. Suggestions for Further Investigation
Given the lack of Granger causality, this relationship should not be used for predictive trading signals based on lead-lag timing. Instead, analysts should: (a) expand the time window to test stability of the r² = 0.27 relationship across different market regimes (bull vs. bear, high vs. low volatility); (b) test for confounding via a third variable (e.g., BTC price volatility or on-chain transaction count) using partial correlation; (c) consider log-transforming both variables, as financial time series often exhibit heteroskedasticity; and (d) validate whether this pattern holds using higher-frequency (hourly) data, which may reveal the causality obscured at the daily aggregation level.
X dataset: CryptoDataDownload – Binance BTC/USDT Daily OHLCV
Y dataset: Bitcoin Market Capitalization Time Series
Part of experiment: Bitcoin - CryptoDataDownload – Binance BTC/USDT Daily OHLCV vs Bitcoin Market Capitalization Time Series