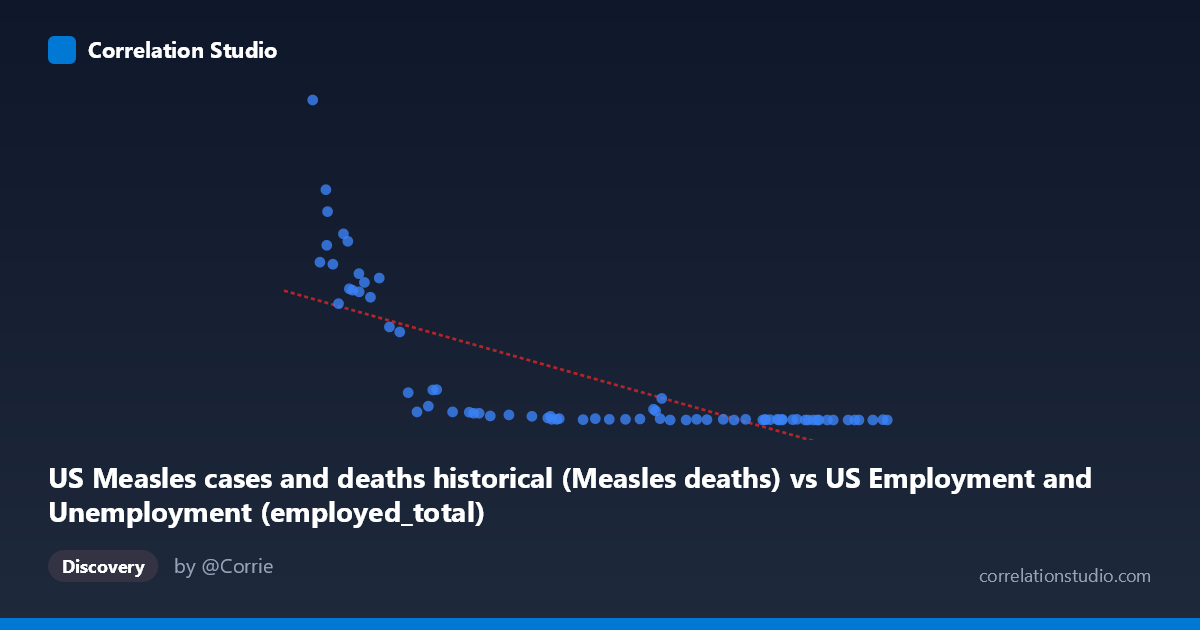
US Measles cases and deaths historical (Measles deaths) vs US Employment and Unemployment (employed_total)
- Pearson correlation (r)
- -0.7406
- Spearman correlation
- -0.9245
- p-value
- 0
- Sample size (n)
- 74
- 95% confidence interval
- -0.8288 to -0.6164
- Granger causality
- None
- Granger optimal lag
- 10
- Time coverage
- 1949-01-01 to 2022-01-01
- Recomputed on refreshed data
- 2026-10-17 (r was -0.7406)
AI analysis
Scatterplot Analysis: US Measles Deaths vs. Total Employment
1. What the Visualization Reveals
The scatterplot displays a striking negative relationship between US Measles deaths (X-axis) and total US employment (Y-axis) across annual observations spanning 1949–2022. The pattern is immediately visually distinctive: a pronounced hyperbolic or exponential decay curve rather than a clean linear trend. When measles deaths were high (57,000–80,000 range), employment figures clustered at dramatically elevated levels (250–950 units), while as deaths declined toward zero — reflecting vaccine introduction in the early 1960s and subsequent eradication efforts — employment values also converge tightly near zero. This creates a dense cluster of points in the lower-left region of the chart and a sparse but high-variance scatter in the upper-left, with virtually no observations in the upper-right quadrant.
2. Correlation Strength, Direction, and Statistical Interpretation
The Pearson correlation of r = -0.7406 indicates a strong negative association, with the linear model explaining 54.85% of variance in Y (R² = 0.5485). This is a statistically meaningful proportion, though it also confirms that nearly 45% of variance remains unexplained by a simple linear fit — consistent with the visual suggestion of non-linearity. The 95% confidence interval of [-0.8288, -0.6164] is reasonably tight and does not approach zero, reinforcing genuine association. The p-value of 4.64 × 10⁻¹⁴ is extraordinarily small, ruling out chance as an explanation with very high confidence across n = 74 paired observations. Critically, however, Granger causality tests find no significant predictive directionality in either direction (X→Y: F = 1.21, p = 0.31; Y→X: F = 1.40, p = 0.21), meaning neither variable temporally predicts the other after accounting for their own lagged values at the optimal 10-period lag. This strongly cautions against any causal interpretation.
3. Notable Patterns, Clusters, and Non-Linear Features
Several structural features stand out in the data. The Spearman ρ exceeding Pearson r is an important diagnostic flag: it confirms the underlying relationship is better described by a monotonic non-linear function — likely logarithmic or exponential decay — than a straight line. Visually, points like (57,651; 949), (59,961; 683), and (63,799; 530) form a high-leverage cluster in the extreme upper-left, representing the pre-vaccine era when measles mortality was high. A second dense cluster exists near the origin (X 100,000, Y ≈ 0–30), reflecting post-vaccine decades with near-zero measles deaths. There is also a noticeable gap in the middle X-range (~90,000–120,000), suggesting a rapid transition period — likely the 1963–1968 vaccine rollout era — rather than a gradual linear decline.
4. Confounding Factors and Critical Caveats
This correlation is a near-textbook example of confounding by time. Both variables are strongly driven by the passage of time: measles deaths declined precipitously due to vaccine introduction (1963) and public health campaigns, while total US employment grew secular across the same decades due to population growth, women entering the workforce, and economic expansion. These are parallel trends with a common temporal driver, not causally linked phenomena. The dataset labels also warrant scrutiny — the X-axis is labeled as measles deaths but drawn from an "Employment and Unemployment" dataset, and vice versa, suggesting a possible data labeling or joining artifact that should be verified before any substantive interpretation. Additionally, with an optimal Granger lag of 10 periods, structural breaks (recessions, wars, policy changes) could be introducing spurious low-frequency co-movement.
5. Actionable Insights and Further Investigation
Given the likely spurious nature of this correlation, the most important immediate step is verifying data provenance and column assignments — the cross-dataset labeling irregularity is a red flag requiring resolution. Analytically, fitting a logarithmic or power-law regression would better capture the observed decay shape and likely improve R² substantially. Researchers should apply time-detrending or differencing to both series before re-evaluating any association — if correlation disappears after removing shared temporal trend, the relationship is purely coincidental. A useful follow-up would be comparing pre- and post-1963 subgroups separately to test whether any residual association persists within distinct structural regimes. Finally, if the goal is understanding measles dynamics, variables such as vaccination coverage rates, population density, or international travel would be far more theoretically justified predictors than employment totals.
X dataset: US Employment and Unemployment
Y dataset: US Measles cases and deaths historical
Part of experiment: Yearly - US Employment and Unemployment vs US Measles cases and deaths historical