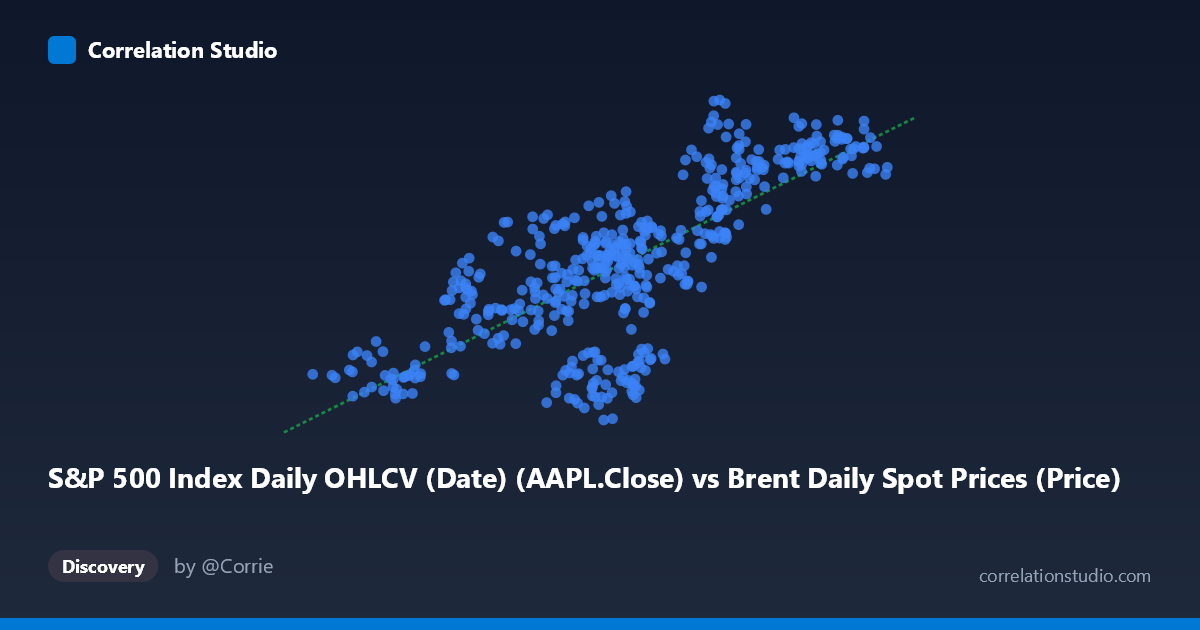
S&P 500 Index Daily OHLCV (Date) (AAPL.Close) vs Brent Daily Spot Prices (Price)
- Pearson correlation (r)
- 0.7646
- Spearman correlation
- 0.7607
- p-value
- 0
- Sample size (n)
- 504
- 95% confidence interval
- 0.7257 to 0.7986
- Granger causality
- None
- Granger optimal lag
- 1
AI analysis
Analysis: AAPL Close Price vs. Brent Crude Oil Spot Price (2015–2017)
Relationship Overview The scatterplot reveals a moderate-to-strong positive relationship between Apple's closing stock price (AAPL.Close) and Brent crude oil spot prices over the two-year period from February 2015 to February 2017. As AAPL's price ranges from roughly $26 to $66, Brent prices correspondingly span approximately $90 to $136. The linear regression equation (y = 1.003x + 64.52) suggests a near 1:1 unit relationship on the surface, though this numerical coincidence is largely a function of the overlapping price scales rather than any meaningful economic equivalence. The general upward trend is visually apparent across the point cloud, indicating that both assets tended to move in the same direction during this period.
Correlation Strength and Statistical Framing The Pearson correlation of r = 0.7646 is statistically robust, with a p-value effectively at zero and a tight 95% confidence interval of [0.726, 0.799], leaving virtually no doubt that a significant positive association exists in the sample. However, the R² of 0.5846 is the more practically informative figure: only 58.5% of the variance in Brent prices is explained by AAPL's price level, meaning roughly 41.5% of Brent's variation is driven by factors entirely unrelated to AAPL's trajectory. Critically, the Granger causality tests show no significant predictive direction in either direction (X→Y: F = 0.095, p = 0.758; Y→X: F = 0.524, p = 0.470). This means that knowing AAPL's price today does not help predict tomorrow's Brent price, and vice versa — the correlation reflects co-movement, not temporal predictability or causal influence.
Patterns, Clusters, and Outliers The point cloud shows several notable structural features. There appears to be a loose clustering in the mid-range (AAPL ~$44–$55, Brent ~$105–$120), reflecting the dominant trading range across much of the sample period. A secondary cluster at the lower-left (AAPL ~$29–$37, Brent ~$94–$110) likely corresponds to the pronounced market weakness in both assets during early-to-mid 2015 and the oil price downturn of late 2015 to early 2016. A few points at the upper right (AAPL ~$63–$66, Brent ~$126–$135) represent the recovery phase. Several potential outliers are visible — most notably points like (54.16, 135.35) and (46.08, 92.51), which deviate substantially from the regression line and suggest episodes where the two assets decoupled. These deviations widen the residual variance and are consistent with the unexplained 41.5% of variance.
Confounding Factors and Caveats The most important caveat here is that this correlation is almost certainly spurious, driven by a shared macroeconomic backdrop rather than any direct economic link between AAPL stock and Brent crude. Both assets were simultaneously influenced by global risk sentiment, USD strength, and the broad macro cycle during 2015–2017 — a period that included a significant oil price collapse and partial recovery, as well as broader equity market volatility. This is a textbook example of confounding by a common third variable (e.g., global economic conditions or investor risk appetite). Additionally, the dataset labels appear to be swapped in the axis descriptions — AAPL.Close is sourced from a Brent dataset file and Brent Price from an S&P 500 file — suggesting a data pipeline or labeling error that warrants verification before drawing any conclusions. The two-year window also introduces survivorship and period-selection bias, as the specific 2015–2017 window may not generalize to other time periods.
Actionable Insights and Further Investigation Given the absence of Granger causality, this correlation should not be used for trading signals or forecasting in either direction. Practitioners should investigate whether a latent common factor — such as a risk-on/risk-off index, the U.S. dollar index (DXY), or global PMI data — explains the shared variance more parsimoniously. A partial correlation analysis controlling for broader market indices (e.g., S&P 500 returns or VIX) would help isolate whether any residual relationship remains once systemic factors are removed. It would also be valuable to extend the time horizon beyond 2015–2017 to test whether this correlation holds across different macro regimes, particularly during periods where oil and tech equities historically diverged. Finally, confirming and correcting the apparent dataset labeling inconsistency is an essential first step before any further analytical work proceeds.
X dataset: Brent Daily Spot Prices
Y dataset: S&P 500 Index Daily OHLCV (Date)
Part of experiment: Daily - Brent Daily Spot Prices vs S&P 500 Index Daily OHLCV (Date)