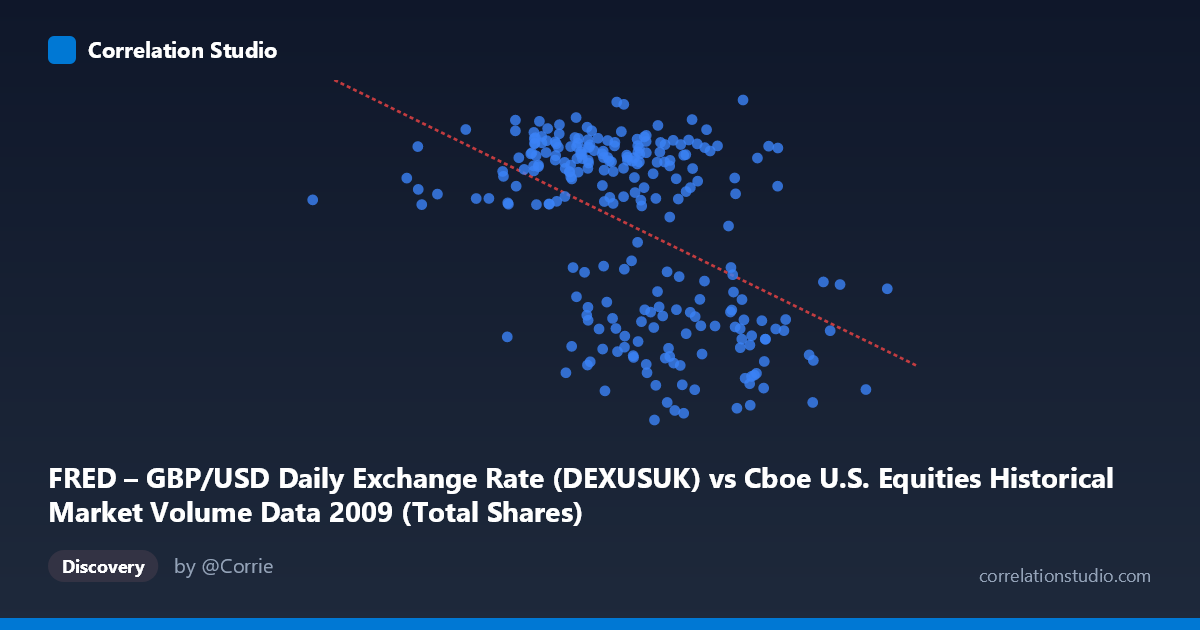
FRED – GBP/USD Daily Exchange Rate (DEXUSUK) vs Cboe U.S. Equities Historical Market Volume Data 2009 (Total Shares)
- Pearson correlation (r)
- -0.4719
- Spearman correlation
- -0.4286
- p-value
- 0
- Sample size (n)
- 250
- 95% confidence interval
- -0.563 to -0.3694
- Granger causality
- None
- Granger optimal lag
- 1
AI analysis
Analysis: GBP/USD Exchange Rate vs. U.S. Equity Market Volume (2009)
Relationship Overview
The scatterplot reveals a moderate negative relationship between U.S. equity market trading volume (X-axis, measured in shares) and the GBP/USD exchange rate (Y-axis). As daily equity trading volume increases, the pound tends to weaken relative to the dollar. The linear regression equation (y = -2.86567E-10x + 1.78458) captures this downward slope, suggesting that higher U.S. market activity — likely concentrated during periods of stress or volatility — coincides with a stronger dollar. This pattern is contextually plausible for 2009, a year dominated by the aftermath of the global financial crisis, during which risk-off sentiment simultaneously drove flight-to-dollar flows and elevated trading volumes.
Correlation Strength and Statistical Significance
The Pearson correlation of r = -0.4719 indicates a moderate negative association, but the explanatory power is meaningfully limited: r² = 0.2227 means only ~22.3% of the variance in GBP/USD is explained by trading volume, leaving roughly 78% attributable to other factors. The 95% confidence interval of [-0.5630, -0.3694] is reasonably tight and entirely negative, confirming directional consistency. The p-value of 2.887E-15 is highly significant given n = 250 and N = 3,232, making chance an implausible explanation for the observed pattern. However, Granger causality tests find no significant predictive direction in either direction (X→Y: F = 0.261, p = 0.610; Y→X: F = 0.225, p = 0.636). This is a critical nuance — while the correlation is statistically robust, neither variable temporally predicts the other at a one-period lag, strongly cautioning against any causal or trading-signal interpretation.
Notable Patterns and Outliers
Several features in the data deserve attention. The GBP/USD values cluster tightly between approximately 1.37 and 1.70, reflecting the real-world trading range of sterling's recovery trajectory throughout 2009. Volume, however, spans an enormous range — from roughly 192 million to over 1.2 billion shares — with the distribution skewed toward higher-volume days. Visible in the sample points, extreme high-volume observations (e.g., ~1.08B and ~1.21B shares) correspond to notably lower exchange rates (~1.38–1.50), anchoring the negative slope. Conversely, moderate-volume days show considerable scatter in GBP/USD, suggesting the relationship is driven largely by the tails. The point at (192,269,942, 1.59) stands out as an unusually low-volume outlier, possibly reflecting a holiday-shortened session.
Confounding Factors and Caveats
This correlation almost certainly reflects common causation from macroeconomic stress rather than a direct mechanism between these two variables. In 2009, the financial crisis created simultaneous conditions: heightened volatility drove both increased equity trading volumes and dollar strengthening (safe-haven demand). Both variables were likely responding to a shared third factor — risk appetite or systemic uncertainty — rather than influencing each other directly. Additionally, the GBP/USD rate is influenced by UK-specific factors (Bank of England policy, UK economic data) entirely orthogonal to U.S. equity volume. The absence of Granger causality reinforces this interpretation. Aggregating across all U.S. equity exchanges and TRFs may also mask intraday dynamics that a daily sampling frequency cannot capture.
Actionable Insights and Further Investigation
Given the moderate but unexplained majority of variance and the absence of Granger causality, this correlation should not be used as a standalone predictive signal. Recommended next steps include: (1) introducing a volatility proxy (e.g., VIX) as a covariate to test whether it absorbs the shared variance and reduces the apparent correlation; (2) segmenting 2009 by crisis phases (Q1 acute stress vs. Q3-Q4 recovery) to assess whether the relationship is regime-dependent and non-stationary; (3) testing at higher frequencies (intraday) where volume-FX relationships, if mechanistic, would manifest more clearly; and (4) examining whether specific exchange sub-volumes (e.g., Cboe vs. NYSE TRF) drive the pattern disproportionately. The 2009 context is highly idiosyncratic, and replication across other years would be essential before drawing broader conclusions.
X dataset: Cboe U.S. Equities Historical Market Volume Data 2009
Y dataset: FRED – GBP/USD Daily Exchange Rate
Part of experiment: Daily - Cboe U.S. Equities Historical Market Volume Data 2009 vs FRED – GBP/USD Daily Exchange Rate