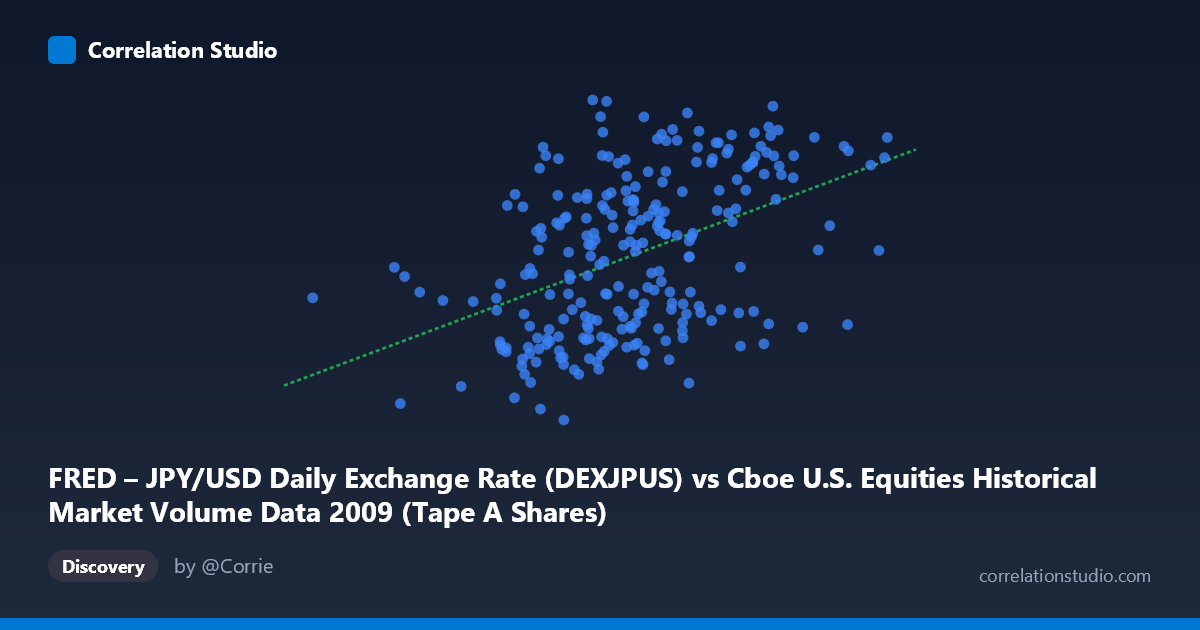
FRED – JPY/USD Daily Exchange Rate (DEXJPUS) vs Cboe U.S. Equities Historical Market Volume Data 2009 (Tape A Shares)
- Pearson correlation (r)
- 0.4464
- Spearman correlation
- 0.4542
- p-value
- 0
- Sample size (n)
- 250
- 95% confidence interval
- 0.3412 to 0.5405
- Granger causality
- None
- Granger optimal lag
- 1
AI analysis
Scatterplot Analysis: JPY/USD Exchange Rate vs. Cboe U.S. Equities Market Volume (2009)
1. Overall Relationship Revealed by the Visualization
The scatterplot reveals a modest positive association between daily U.S. equity market trading volume (X-axis, measured in shares) and the JPY/USD exchange rate (Y-axis, measured in yen per dollar). As trading volume increases, there is a slight tendency for the yen-per-dollar rate to be higher (i.e., a weaker yen relative to the dollar). The linear regression equation (y = 1.635×10⁻⁸x + 86.45) shows an extremely shallow slope, reflecting that very large changes in volume correspond to relatively modest movements in the exchange rate. The data points are broadly dispersed across the plot, suggesting the relationship is real but far from deterministic, with considerable scatter around the regression line throughout the volume range of approximately 105 million to 704 million shares.
2. Correlation Strength, Direction, and Statistical Significance
The Pearson correlation of r = 0.4464 indicates a moderate positive relationship, but the explanatory power is limited: R² = 0.1992, meaning only about 19.9% of the variance in the JPY/USD rate is accounted for by equity trading volume. Put differently, roughly 80% of day-to-day exchange rate variation is driven by factors entirely outside this model. The 95% confidence interval of [0.34, 0.54] is meaningfully above zero and reasonably tight for a financial dataset, lending credibility to the direction of the effect. The p-value of 1.21×10⁻¹³ is extraordinarily small relative to any conventional threshold, confirming the correlation is highly unlikely to be a statistical artifact given the sample of 250 paired observations drawn from a population of 3,232 trading days. However, statistical significance here is heavily influenced by sample size and does not imply economic or causal significance. Critically, the Granger causality tests fail in both directions (X→Y: F = 0.011, p = 0.916; Y→X: F = 0.815, p = 0.367), meaning neither variable meaningfully predicts the other at the next time step. This is a key finding: the correlation exists contemporaneously but carries no detectable temporal predictive information in either direction.
3. Notable Patterns, Clusters, and Outliers
Several features stand out in the point cloud. There appears to be a moderate concentration of observations in the volume range of roughly 350–550 million shares paired with exchange rates between 89 and 96 yen/dollar, forming a loose central cluster consistent with the mean values (X̄ ≈ 440M, Ȳ ≈ 93.65). The sample points reveal a few potential outliers worth noting: the observation at approximately (704M shares, 99.0 yen) represents both the maximum volume and a near-maximum exchange rate, sitting at the upper-right extreme of the distribution. Similarly, (105M shares, 91.7 yen) anchors the lower-left, though its Y-value is not extreme, which slightly weakens the linear story. Points like (509M, 91.0) and (551M, 89.5) show high-volume days with notably low exchange rates, indicating meaningful departures from the regression line and hinting at non-linearity or regime-specific behavior. The spread in Y is relatively constrained (86.12–100.71 yen, a ~14-yen range), while X spans nearly a 7-fold range, so heteroscedasticity—where variance in Y may differ across the X range—is worth examining formally.
4. Confounding Factors and Interpretive Caveats
This correlation almost certainly reflects shared temporal trends rather than a direct causal mechanism. Both variables are time-indexed to 2009—a year dominated by the aftermath of the global financial crisis and subsequent recovery. During market stress (early 2009), trading volumes were elevated due to panic selling, while the yen was strengthening (lower yen/dollar values, meaning fewer yen per dollar) as a safe-haven currency—this would actually work against a positive correlation. As markets stabilized through mid-to-late 2009, volumes may have normalized while the yen weakened (higher values), potentially creating a spurious trend-driven correlation. Seasonality, macroeconomic policy announcements (Fed/BOJ actions), risk-on/risk-off sentiment shifts, and index rebalancing events could all simultaneously affect both variables without one causing the other. The axes as labeled also appear to have their dataset descriptions swapped in the metadata (X described as exchange rate data from Cboe volume dataset and vice versa), which warrants verification before drawing any conclusions.
5. Actionable Insights and Further Investigation
Given the absence of Granger causality and the moderate but incomplete explanatory power, practitioners should treat this correlation as descriptive rather than predictive. The most productive next steps would include: (a) detrending both series (e.g., using first differences or log-returns) to remove the shared 2009 recovery trajectory before re-evaluating correlation; (b) testing longer lag structures beyond the optimal lag-1 used here, as currency-volume relationships may operate over weekly or multi-day horizons; (c) segmenting the data by market regime—separating the crisis period (Q1 2009) from the recovery (Q2–Q4) to test whether the correlation is regime-dependent; and (d) introducing control variables such as VIX levels, S&P 500 returns, or Fed policy indicators to isolate residual correlation. Finally, confirming the correct variable assignment on each axis is essential before any further modeling, given the metadata inconsistency noted above.
X dataset: Cboe U.S. Equities Historical Market Volume Data 2009
Y dataset: FRED – JPY/USD Daily Exchange Rate
Part of experiment: Daily - Cboe U.S. Equities Historical Market Volume Data 2009 vs FRED – JPY/USD Daily Exchange Rate