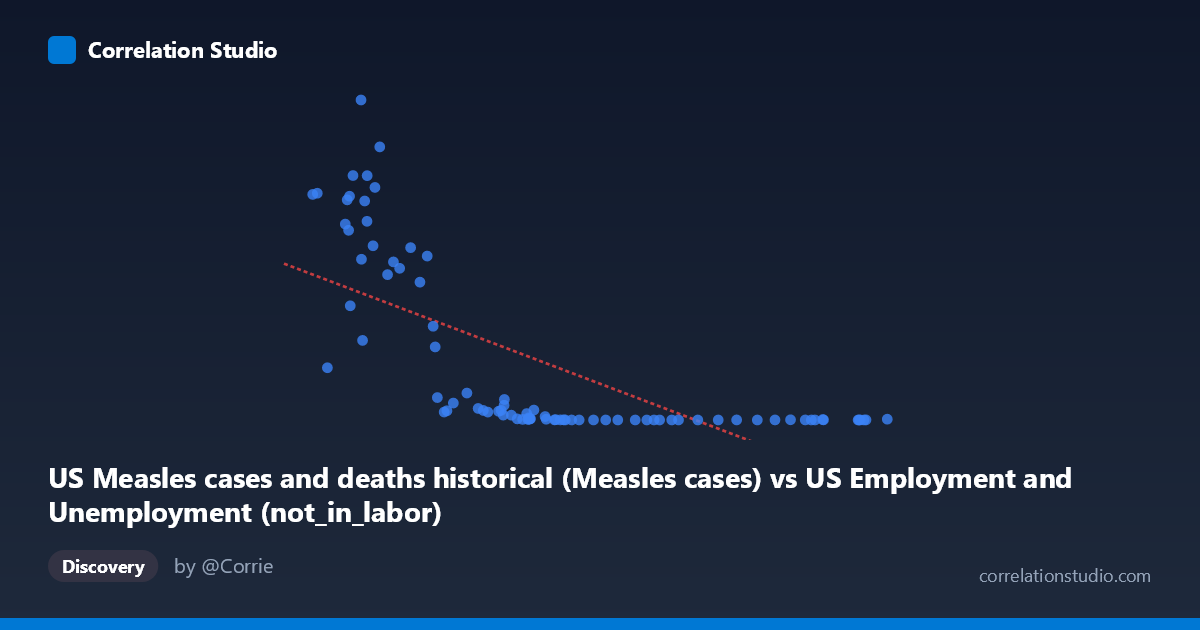
US Measles cases and deaths historical (Measles cases) vs US Employment and Unemployment (not_in_labor)
- Pearson correlation (r)
- -0.6886
- Spearman correlation
- -0.9124
- p-value
- 0
- Sample size (n)
- 85
- 95% confidence interval
- -0.7863 to -0.5573
- Granger causality
- None
- Granger optimal lag
- 10
- Time coverage
- 1941-01-01 to 2025-01-01
- Recomputed on refreshed data
- 2026-10-17 (r was -0.6886)
AI analysis
Scatterplot Analysis: US Measles Cases vs. Not-in-Labor-Force Population
1. What the Visualization Reveals
The scatterplot displays a striking negative relationship between historical US measles case counts (X-axis) and the "not in labor force" population (Y-axis), spanning data from 1941 to 2025. The overall pattern shows that as measles cases were high (particularly in the lower X range of ~38,000–55,000), the not-in-labor-force figures were dramatically elevated — sometimes exceeding 600,000–894,000. As measles cases move toward higher values (60,000+), the Y values collapse sharply toward near-zero levels. This creates a distinctive L-shaped or hyperbolic curve rather than a clean linear trend, immediately signaling that a linear model is an imperfect descriptor of what is fundamentally a non-linear relationship.
2. Correlation Strength, Direction, and Statistical Framing
The Pearson correlation of r = -0.689 indicates a moderate-to-strong negative association, and the R² of 0.474 means that roughly 47% of the variance in the not-in-labor-force variable is statistically "explained" by measles case counts within this linear framework — leaving 53% unexplained. The 95% confidence interval of [-0.786, -0.557] is relatively narrow and does not cross zero, and the p-value of 3.26 × 10⁻¹³ confirms the correlation is extraordinarily unlikely to arise by chance. However, the fact that Spearman ρ exceeds Pearson r — explicitly flagged in the regression note — strongly suggests the true relationship is non-linear (likely logarithmic or power-law), meaning the linear R² of 47.4% is almost certainly an underestimate of the actual associative strength once a better-fitting model is applied. Granger causality tests show no significant predictive directionality in either direction (X→Y: F=1.51, p=0.16; Y→X: F=1.60, p=0.13), meaning neither variable temporally predicts the other after accounting for lags up to 10 periods — a critical caveat for any causal interpretation.
3. Notable Patterns, Clusters, and Outliers
The data segregates into two visually distinct clusters: - A high-Y, low-X cluster (X: ~38,000–55,000; Y: ~100,000–894,000) corresponding to earlier decades when both measles cases were at certain levels and labor force participation patterns differed structurally - A low-Y, high-X cluster (X: ~60,000–103,000; Y: ~13–75,000) where the data compresses tightly near zero on the Y-axis
Several extreme outliers are visible at the high-Y end: points at (43,990; 894,134), (46,088; 763,094), (44,678; 682,720), and (43,093; 683,077) represent extraordinary not-in-labor-force values that may disproportionately influence the regression slope. The point at (102,846; 2,288) represents the highest measles case count yet a near-zero labor force figure. The hyperbolic shape of the cloud strongly supports a logarithmic or inverse transformation of X as a more appropriate modeling approach.
4. Confounding Factors and Critical Caveats
This correlation almost certainly represents a spurious temporal coincidence rather than any meaningful causal mechanism. Both variables are time-indexed annual series (1941–2025), and their apparent association is driven overwhelmingly by secular historical trends: measles cases declined dramatically following the 1963 vaccine introduction, while labor force participation and "not in labor force" population counts were simultaneously transformed by population growth, demographic shifts, women's workforce entry, and changing BLS definitions. The dataset labels themselves reveal a metadata mismatch — measles data is paired with an employment column, and employment data is paired with a measles column, suggesting the axes may represent cross-joined datasets where the underlying driver is simply calendar year acting as a common confound. The Granger non-result further reinforces that there is no temporal mechanistic link between these phenomena.
5. Actionable Insights and Further Investigation
Given the non-linear signal and the strong suspicion of spurious correlation driven by time, the most valuable next steps would include: (1) explicitly including year as a covariate or running a partial correlation controlling for time to test whether the r = -0.689 survives; (2) fitting a logarithmic or power-law regression to properly capture the hyperbolic distribution — the improved R² would better characterize the associative strength; (3) applying first-differencing or detrending both series before re-running correlation and Granger tests to eliminate shared temporal drift; and (4) investigating the extreme high-Y outliers individually to confirm data integrity, as values near 894,000 in the "not in labor force" column warrant verification against BLS source records. This analysis should be treated as a cautionary example of spurious correlation driven by parallel historical trends rather than any actionable public health or labor market insight.
X dataset: US Employment and Unemployment
Y dataset: US Measles cases and deaths historical
Part of experiment: Yearly - US Employment and Unemployment vs US Measles cases and deaths historical