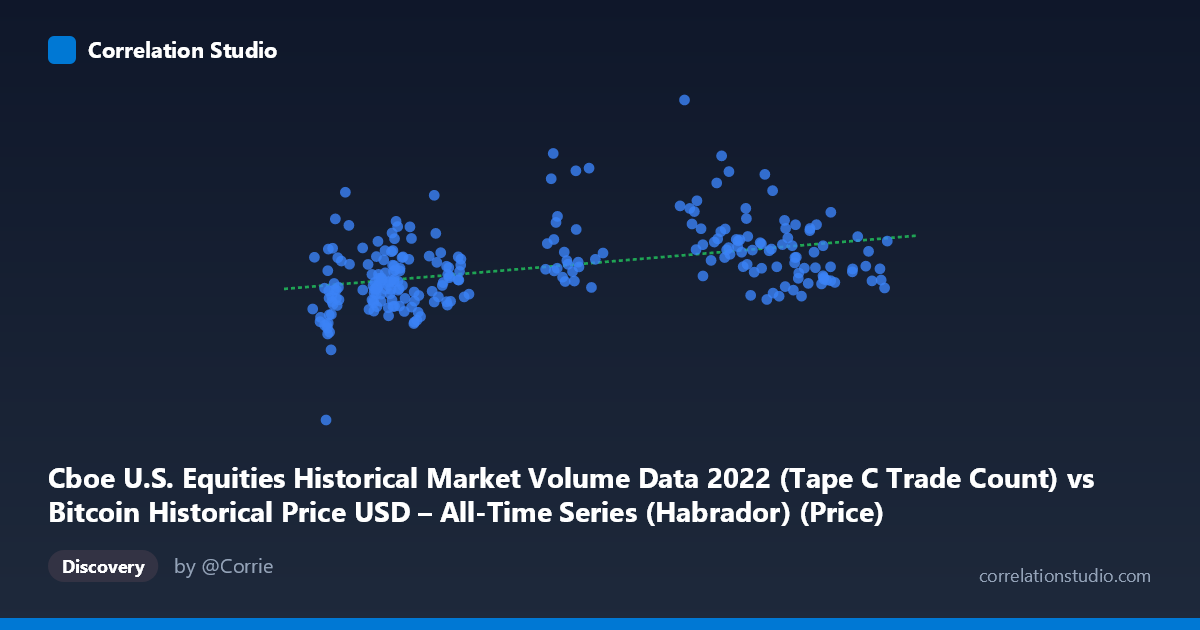
Cboe U.S. Equities Historical Market Volume Data 2022 (Tape C Trade Count) vs Bitcoin Historical Price USD – All-Time Series (Habrador) (Price)
- Pearson correlation (r)
- 0.4228
- Spearman correlation
- 0.4624
- p-value
- 0
- Sample size (n)
- 251
- 95% confidence interval
- 0.3154 to 0.5194
- Granger causality
- None
- Granger optimal lag
- 10
- Time coverage
- 2022-01-03 to 2022-12-30
AI analysis
Analysis: Bitcoin Price vs. Cboe Equities Trade Count (2022)
1. Overview of the Relationship
The scatterplot shows a modest positive association between Cboe Tape C trade counts (X) and Bitcoin's daily USD price (Y) across 251 sampled trading days in 2022. As trade counts increase from roughly 15,800 to 47,500, Bitcoin prices show a general upward drift, but the relationship is loose and noisy rather than tight or deterministic. The point cloud is diffuse, with substantial vertical scatter at nearly every X value — for instance, trade counts near 20,000 correspond to Bitcoin prices ranging from ~$1.35M to ~$2.02M (note: these Y-values appear scaled/indexed rather than raw spot prices, given the ~$650K–$2.9M range).
2. Strength, Direction, and Statistical Confidence
The correlation coefficient (r = 0.423) indicates a weak-to-moderate positive linear relationship. Critically, r² = 0.179 means only 17.9% of the variance in Bitcoin price is explained by trade count — the remaining ~82% is driven by other factors entirely. The 95% CI [0.315, 0.519] is reasonably tight and excludes zero, and the p-value (2.65E-12) confirms this correlation is highly statistically significant — but statistical significance here reflects the large N (4,769 population, 251 sampled) more than practical predictive power. A correlation this modest should not be used for point forecasting.
The Granger causality results are important context: neither variable significantly Granger-causes the other at the optimal lag of 10 periods (X→Y: p=0.713; Y→X: p=0.089, only marginally suggestive). This means the historical co-movement does not reflect a reliable lead-lag predictive relationship in either direction — the correlation is likely contemporaneous/coincidental or driven by shared external factors, not one variable temporally forecasting the other.
3. Patterns and Notable Features
Several clusters are visible: a dense cluster in the X range of 16,000–23,000 with Y values mostly between $1.35M–$1.85M, and a second cluster in the X range of 38,000–46,000 with more elevated and more dispersed Y values ($1.6M–$2.4M). A few clear outliers stand out — points like (29,047.75, 2,539,164.95), (38,737.27, 2,411,035.26), and (40,716.68, 2,391,498.79) sit well above the general trend, pulling the regression line upward. There's no evidence of a strong nonlinear pattern (e.g., exponential or logarithmic curve) — the relationship looks broadly linear but with high residual variance, and no obvious regime break or threshold effect within the sampled range.
4. Confounding Factors and Caveats
Both series are time-ordered daily 2022 data, making them vulnerable to spurious correlation via shared trends — 2022 was a broad risk-off year for both equities and crypto (Fed tightening, rising rates), so both series may be co-moving due to a common macro driver (interest rates, risk sentiment, liquidity conditions) rather than any causal link between Cboe trade counts and Bitcoin price. Additionally, the dataset pairing itself is unusual: Bitcoin price history (multi-year) merged with a single-year (2022) equities volume dataset suggests these were joined on date without strong theoretical justification. Trade count is also a volume/activity metric, not a price metric, so comparing it to price rather than equities volume/price is an odd pairing that may not reflect any real economic mechanism. Non-stationarity (both series likely trending) is a classic cause of inflated correlation in time series and should be tested (e.g., via differencing or unit-root tests) before trusting r.
5. Recommendations for Further Investigation
- Difference or detrend both series before recomputing correlation to rule out spurious trend-driven association. - Test against a macro control variable (e.g., 10-year Treasury yield, VIX, or a risk-sentiment index) to see if it absorbs the shared variance. - Given the Granger results, do not use this pair for predictive trading signals — the lack of lead-lag causality in either direction undermines any forecasting rationale. - Investigate whether Cboe trade count should instead be compared to equities price/index level (a more theoretically direct pairing) rather than Bitcoin price, and separately assess if Bitcoin price correlates with crypto-specific volume/activity metrics. - Treat r² = 0.18 as a signal that this relationship, while statistically real, is not economically substantial — over 80% of Bitcoin's price variance in 2022 is explained by factors outside this model.
X dataset: Bitcoin Historical Price USD – All-Time Series (Habrador)
Y dataset: Cboe U.S. Equities Historical Market Volume Data 2022
Part of experiment: Bitcoin - Bitcoin Historical Price USD – All-Time Series (Habrador) vs Cboe U.S. Equities Historical Market Volume Data 2022