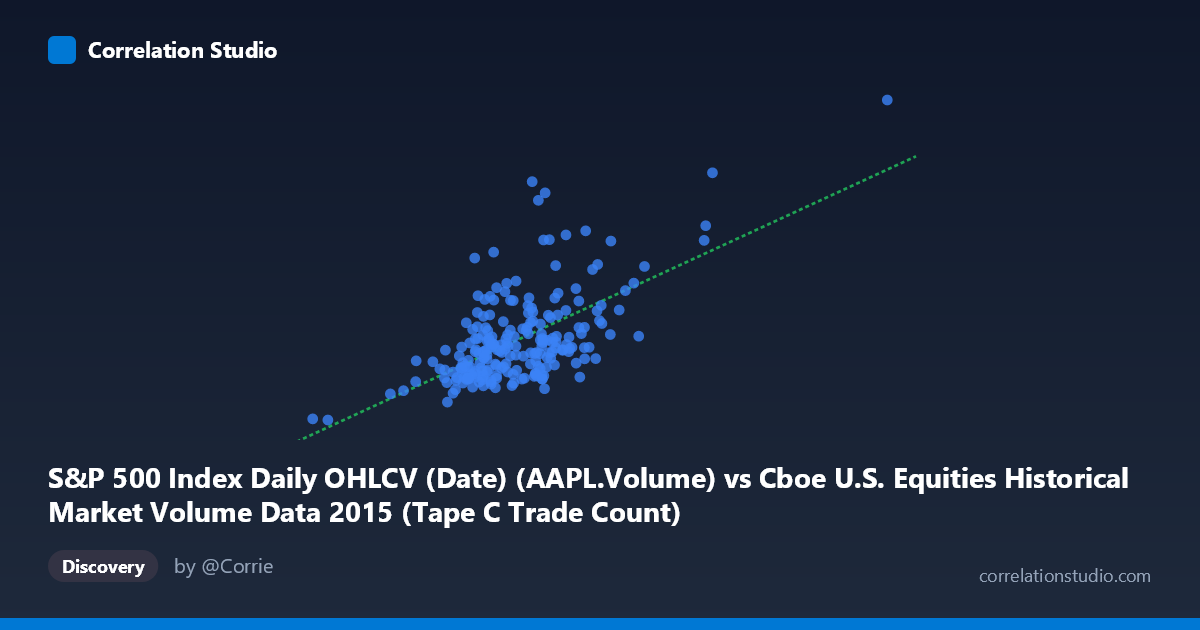
S&P 500 Index Daily OHLCV (Date) (AAPL.Volume) vs Cboe U.S. Equities Historical Market Volume Data 2015 (Tape C Trade Count)
- Pearson correlation (r)
- 0.616
- Spearman correlation
- 0.5129
- p-value
- 0
- Sample size (n)
- 222
- 95% confidence interval
- 0.5271 to 0.6916
- Granger causality
- None
- Granger optimal lag
- 10
AI analysis
Scatterplot Analysis: AAPL Trading Volume vs. Cboe Tape C Trade Count (2015)
Relationship Overview
The scatterplot reveals a moderately positive relationship between Apple Inc.'s daily trading volume (S&P 500 OHLCV dataset) and the Cboe U.S. Equities Tape C Trade Count for 2015. As AAPL volume increases, Tape C trade counts tend to rise proportionally, which is broadly intuitive — days with heightened activity in a major index constituent like AAPL are likely to coincide with broader market activity surges. The linear regression equation (y = 93.43x − 20,811,800) suggests that each additional unit of AAPL volume is associated with approximately 93 additional Tape C trades, though this relationship is far from deterministic across the full data range.
Correlation Strength and Statistical Framing
The Pearson correlation of r = 0.616 indicates a moderate-to-strong positive association, but the coefficient of determination r² = 0.3795 is the more sobering figure — only 37.9% of the variance in Tape C trade counts is explained by AAPL volume alone. The remaining ~62% is attributable to other factors entirely. The 95% confidence interval of [0.527, 0.692] is relatively tight and does not approach zero, and the p-value of effectively 0 confirms this correlation is highly statistically significant and not a chance artifact in the sample of n = 222 paired observations. However, the Granger causality results firmly deflate any temporal predictive narrative: neither direction achieves significance (X→Y: F = 1.11, p = 0.36; Y→X: F = 0.91, p = 0.53) at the optimal lag of 10 periods. This means that past AAPL volume does not reliably predict future Tape C trade counts, and vice versa — the correlation is concurrent rather than directionally predictive.
Notable Patterns, Clusters, and Outliers
The bulk of the data clusters densely in a relatively confined region — AAPL volumes roughly between 550,000 and 950,000 and Tape C counts between 25 million and 75 million — forming a visible core cloud with moderate scatter around the regression line. Two data points stand out as significant outliers that warrant attention: the point near (1,611,853; 162,206,300) is an extreme outlier on both axes, likely corresponding to a high-volatility market event (e.g., a major AAPL earnings release or a broad market shock in 2015 such as the August flash crash). A second moderate outlier near (795,595; 124,138,600) shows unusually high Tape C activity relative to its AAPL volume, suggesting a market-wide event not specifically driven by AAPL. The lower-left region contains a sparse cluster of lower-activity days, including the minimum point near (325,915; 13,046,400), possibly a holiday-adjacent or low-liquidity session. These outliers likely exert disproportionate leverage on the regression slope and the r value itself.
Confounding Factors and Interpretive Caveats
Several confounds complicate straightforward interpretation. First, AAPL is a Tape C stock (NASDAQ-listed), meaning its trades are directly included within the Tape C trade count — the two variables are not fully independent, creating a built-in mechanical correlation that inflates r without implying any meaningful external relationship. Second, both variables are jointly driven by broad market sentiment and volatility regimes: days like the August 2015 sell-off would simultaneously spike AAPL volume and all exchange trade counts, making it a classic case of a common third-variable driver (VIX, macroeconomic news, etc.). Third, the dataset spans only ~10 months of a single year (February–December 2015), limiting generalizability. Finally, mixing dataset sources — AAPL volume from an S&P 500 OHLCV dataset cross-referenced against Cboe market structure data — introduces potential timestamp alignment and methodology mismatches that should be audited carefully.
Actionable Insights and Further Investigation
Given the partial explanatory power and the absence of Granger causality, practitioners should avoid using AAPL volume alone as a predictive signal for Tape C activity. More productive next steps would include: (1) controlling for the mechanical overlap by examining the correlation between AAPL volume and non-NASDAQ tape counts (Tape A or Tape B) to isolate a truly independent signal; (2) incorporating VIX or realized volatility as a covariate to test whether it mediates the correlation and reduces r² substantially; (3) re-running the Granger causality test at shorter lags (1–3 periods) to check for very short-term predictive dynamics that a 10-period lag may obscure; and (4) flagging and separately analyzing the extreme outlier session(s) to determine whether the August 2015 market dislocation is disproportionately driving the observed correlation — removing those points would provide a cleaner picture of the baseline relationship during normal market conditions.
X dataset: Cboe U.S. Equities Historical Market Volume Data 2015
Y dataset: S&P 500 Index Daily OHLCV (Date)
Part of experiment: Daily - Cboe U.S. Equities Historical Market Volume Data 2015 vs S&P 500 Index Daily OHLCV (Date)