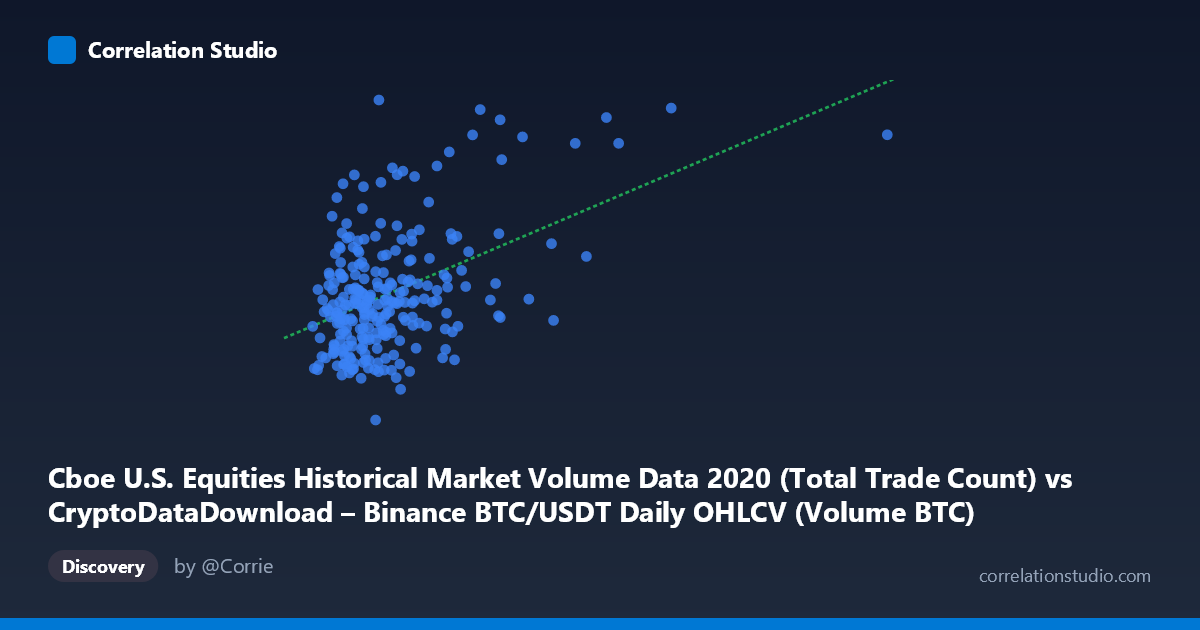
Cboe U.S. Equities Historical Market Volume Data 2020 (Total Trade Count) vs CryptoDataDownload – Binance BTC/USDT Daily OHLCV (Volume BTC)
- Pearson correlation (r)
- 0.4574
- Spearman correlation
- 0.28
- p-value
- 0
- Sample size (n)
- 253
- 95% confidence interval
- 0.354 to 0.5497
- Granger causality
- None
- Granger optimal lag
- 10
AI analysis
Analysis: Cboe Equities Trade Count vs. Binance BTC/USDT Volume (2020)
1. What the Visualization Reveals
The scatterplot shows a moderate positive but noisy relationship between U.S. equities trade counts (Cboe) and BTC/USDT trading volume (Binance) across 253 paired daily observations in 2020. Points are widely scattered around the regression line, with no tight clustering along a clear linear path — most X values fall in a narrow band (~30,000–120,000) while Y values sprawl widely (1.5M–6.5M), producing a fan-shaped, heteroscedastic pattern rather than a clean linear trend.
2. Strength, Direction, and Statistical Meaning
The correlation (r = 0.4574) is positive but modest, with r² = 0.209 indicating that only about 21% of the variance in one variable is explained by the other — the remaining ~79% is driven by other factors entirely. The 95% CI [0.354, 0.550] is reasonably tight and excludes zero, and the p-value (1.75E-14) confirms this correlation is highly statistically significant and not due to chance, given the sample size. However, statistical significance here reflects sample size and consistency, not practical strength — this is a weak-to-moderate relationship in practical terms, not one suitable for precise prediction. Critically, the Granger causality tests show no significant predictive direction in either direction (X→Y: p=0.66; Y→X: p=0.15) at the optimal 10-period lag, meaning neither series reliably helps forecast the other's future values — the correlation is contemporaneous/coincidental rather than causal or lead-lag in nature.
3. Notable Patterns and Outliers
Several data points stand out as high-leverage outliers, particularly (402201.67, 5978943.12) — an X value more than 3x the norm — and (71155.21, 6517558.50), which sits far above the Y range for its X level. These points likely disproportionately influence the regression slope. There's also a visible cluster of high-Y observations (~5M–6.5M) paired with mid-range X values (70,000–170,000), possibly corresponding to a specific period of 2020 (e.g., the March COVID crash or year-end rally) when both crypto and equity markets saw volume spikes simultaneously. No strong nonlinear curvature is apparent — the relationship, such as it is, appears roughly linear but very diffuse.
4. Confounding Factors and Caveats
Both series are time-ordered financial data from 2020, a year marked by extraordinary market-wide volatility (COVID crash, subsequent recovery, and retail trading boom). This creates a classic spurious correlation risk: both equities trading activity and crypto volume may be responding to a common underlying driver (macro volatility, retail participation surges, stimulus-driven liquidity) rather than one causing the other. Additionally, comparing "trade count" (a discrete count metric) to "volume in BTC" (a continuous unit-denominated metric) conflates different measurement scales, and neither series has been detrended or deseasonalized — both may carry autocorrelation and trend components that inflate the correlation coefficient without reflecting genuine covariation.
5. Suggestions for Further Investigation
Analysts should (a) detrend both series or use daily returns/differences rather than levels to test whether the correlation persists once shared trends are removed, (b) test for a common confounding variable (e.g., VIX, overall market liquidity index, or a retail-trading proxy) via partial correlation, (c) run robustness checks excluding the extreme outlier (X≈402K) to see if r changes substantially, and (d) given the lack of Granger causality, avoid using either series as a leading indicator for the other — instead, treat any observed comovement as coincident and explore whether both are driven by a third, unmeasured macro factor.
X dataset: CryptoDataDownload – Binance BTC/USDT Daily OHLCV
Y dataset: Cboe U.S. Equities Historical Market Volume Data 2020
Part of experiment: Bitcoin - CryptoDataDownload – Binance BTC/USDT Daily OHLCV vs Cboe U.S. Equities Historical Market Volume Data 2020