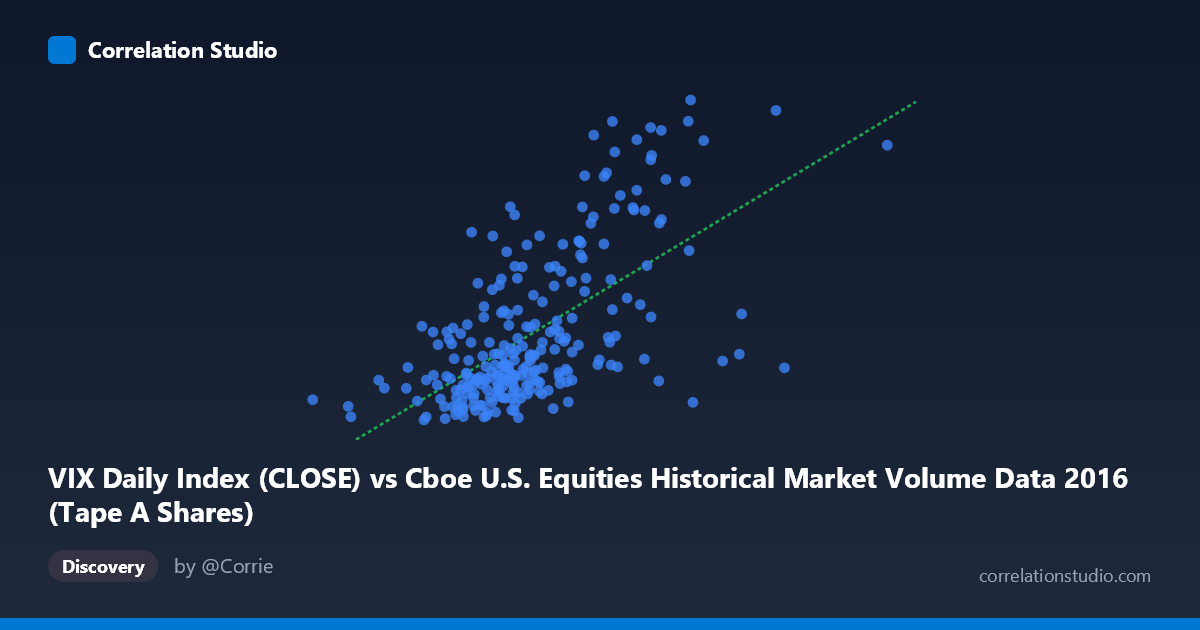
VIX Daily Index (CLOSE) vs Cboe U.S. Equities Historical Market Volume Data 2016 (Tape A Shares)
- Pearson correlation (r)
- 0.6184
- Spearman correlation
- 0.5889
- p-value
- 0
- Sample size (n)
- 252
- 95% confidence interval
- 0.5357 to 0.6893
- Granger causality
- None
- Granger optimal lag
- 1
AI analysis
Scatterplot Analysis: VIX Daily Index vs. Tape A Share Volume (2016)
Relationship Overview The scatterplot reveals a moderate positive relationship between Cboe U.S. equities market volume (Tape A Shares, on the X-axis) and the VIX Daily Index close (Y-axis) across 252 trading days in 2016. As daily share volume increases, VIX levels tend to rise as well — a relationship that is intuitively sensible, since elevated market volatility typically drives heavier trading activity. The linear regression equation (y = 4.18×10⁻⁸x + 4.45) reflects a very shallow but statistically meaningful slope, indicating that each incremental increase in share volume is associated with a small but consistent uptick in VIX.
Correlation Strength and Statistical Interpretation The Pearson correlation of r = 0.6184 indicates a moderate positive association, but the more informative metric is r² = 0.3824, meaning that share volume explains only about 38% of the variance in VIX levels. The remaining 62% is attributable to other factors entirely. The 95% confidence interval of [0.5357, 0.6893] is reasonably narrow given the sample size (n = 252), and the p-value of effectively zero confirms this is not a chance finding. However, Granger causality tests reveal no significant predictive directionality in either direction — neither X→Y (F = 1.43, p = 0.233) nor Y→X (F = 0.62, p = 0.432) reaches significance at a 1-lag structure. This is a critical caveat: while the two variables co-move, neither reliably predicts the other in a temporal sense, suggesting they are co-driven by common underlying forces rather than one causing the other.
Notable Patterns, Clusters, and Outliers The data points show a broadly dispersed cloud with a visible upward trend, but with substantial vertical scatter, particularly at mid-range X values (~220M–300M shares), where VIX values span from roughly 11 to 22. This wide spread confirms the moderate rather than strong correlation. Several high-leverage outliers are apparent at the upper-right of the chart — notably points around (363M shares, 26.7 VIX) and (312M shares, 24.2 VIX) — which likely correspond to specific volatility events in 2016 (e.g., Brexit in late June or the U.S. election in November). A cluster of low-volume, low-VIX observations dominates the lower-left quadrant, suggesting a distinct "calm market" regime. The distribution appears somewhat heteroscedastic, with variance in Y increasing at higher X values, which mildly challenges the assumptions of simple linear regression.
Confounding Factors and Caveats Several important confounders complicate a straightforward interpretation. First, both variables are likely responding to the same external shocks (geopolitical events, earnings seasons, macroeconomic announcements) rather than one driving the other — consistent with the Granger non-causality result. Second, day-of-week and month-end effects systematically influence trading volume independently of volatility. Third, the VIX is a forward-looking implied volatility measure derived from options pricing, while Tape A volume is a contemporaneous realized activity measure — they operate on different informational timescales. Finally, the population size of N = 3,622 referenced in the statistics suggests the sample of 252 may underrepresent the full distributional range, and results should be interpreted with that sampling context in mind.
Actionable Insights and Further Investigation Practitioners should avoid using volume alone as a VIX predictor given the absent Granger causality and the 62% unexplained variance. More productive next steps would include: (1) decomposing the data by identified volatility regimes (e.g., pre/post-Brexit, pre/post-election) to test whether the correlation strengthens within specific episodes; (2) adding lagged VIX terms or options volume as additional predictors in a multivariate model; (3) testing non-linear specifications (e.g., polynomial or log-transformed regression) given the apparent heteroscedasticity; and (4) examining whether intraday volume patterns or trade-count data (also available in this dataset) provide stronger directional signal. The relationship is real and meaningful, but best understood as a co-symptom of market stress rather than a predictive tool in isolation.
X dataset: Cboe U.S. Equities Historical Market Volume Data 2016
Y dataset: VIX Daily Index
Part of experiment: Daily - Cboe U.S. Equities Historical Market Volume Data 2016 vs VIX Daily Index