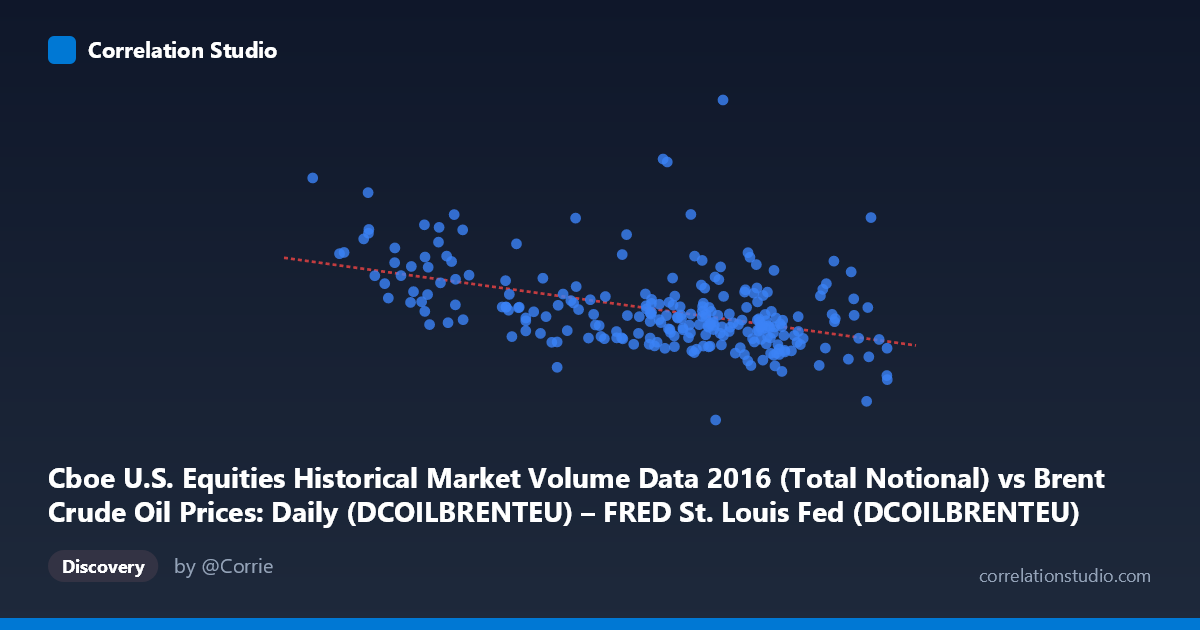
Cboe U.S. Equities Historical Market Volume Data 2016 (Total Notional) vs Brent Crude Oil Prices: Daily (DCOILBRENTEU) – FRED St. Louis Fed (DCOILBRENTEU)
- Pearson correlation (r)
- -0.4521
- Spearman correlation
- -0.4455
- p-value
- 0
- Sample size (n)
- 251
- 95% confidence interval
- -0.5454 to -0.3478
- Granger causality
- None
- Granger optimal lag
- 10
AI analysis
Analysis: Brent Crude Oil Price vs. U.S. Equity Market Notional Volume (2016)
Relationship Overview The scatterplot reveals a moderate negative relationship between the daily Europe Brent crude oil spot price (X-axis, USD/barrel) and U.S. equity market total notional trading volume (Y-axis). As crude oil prices increase, equity market notional volume tends to decline. The linear regression equation (y = -2.869×10⁸x + 3.158×10¹⁰) quantifies this inverse slope, suggesting that each additional dollar per barrel in Brent crude price is associated with roughly a $287 million decrease in daily U.S. equity notional volume. Visually, the data cloud likely shows a downward-sloping central tendency with considerable scatter, consistent with a meaningful but far from deterministic relationship.
Correlation Strength and Statistical Significance The Pearson correlation of r = -0.4521 indicates a moderate negative association. However, the coefficient of determination r² = 0.2044 is the more practically meaningful statistic — it tells us that only about 20.4% of the variance in U.S. equity notional volume is explained by Brent crude oil prices. This means roughly 80% of the day-to-day variation in trading volume is driven by other factors entirely. The result is nonetheless highly statistically significant (p = 4.752×10⁻¹⁴), and the 95% confidence interval of [-0.5454, -0.3478] is reasonably tight and does not cross zero, confirming the negative direction with strong confidence across the population (N = 3,622). The narrow CI reflects the robustness of the finding, though statistical significance should not be mistaken for practical or causal importance here.
Critically, the Granger causality tests return no significant predictive direction in either direction (X→Y: F = 0.5544, p = 0.8497; Y→X: F = 0.4420, p = 0.9245), even at an optimal lag of 10 periods. This is a crucial qualifier: neither variable's past values help predict the other's future values. The correlation is contemporaneous but lacks temporal predictive structure, meaning it cannot be exploited for forecasting in any straightforward way.
Notable Patterns and Outliers Several data points stand out as potential outliers or high-leverage observations. The lowest crude price values (around 26–32 USD/barrel) — notably the points near (26.01, ~32.8B), (27.59, ~25.1B), and (31.83, ~23.5B) — show substantially elevated notional volume relative to the regression line, suggesting that extreme low-price environments may trigger anomalous trading activity (panic selling, rebalancing, or volatility-driven volume spikes). Conversely, mid-range prices (~42–52 USD/barrel) form a dense cluster with relatively compressed volume (~14–22B range), indicating more stable, "normal" market conditions. There also appears to be heteroscedasticity — variance in Y seems larger at lower X values — which violates a core assumption of linear regression and suggests the linear fit may understate uncertainty at low crude price levels.
Confounding Factors and Caveats This correlation is highly susceptible to spurious or indirect causation. Both variables are likely responding independently to broader macro conditions in 2016 — a year marked by oil market instability (OPEC negotiations, supply glut resolution), U.S. election uncertainty, Federal Reserve rate decisions, and global risk sentiment shifts. High equity volume does not necessarily mean selling; it includes all notional traded value. Additionally, notional volume is heavily influenced by stock price levels themselves, sector composition, and ETF/algorithmic activity unrelated to oil. The 2016 time window is narrow, limiting generalizability, and the lack of Granger causality strongly suggests any observed correlation reflects a common-factor relationship rather than a direct mechanical link between crude prices and trading behavior.
Actionable Insights and Further Investigation Given the 80% unexplained variance and absence of Granger causality, practitioners should avoid using Brent crude prices as a standalone predictor of equity market volume. However, the contemporaneous negative correlation warrants further decomposition: investigating whether the relationship is driven specifically by energy sector stocks, broad risk-off episodes, or volatility regimes (e.g., VIX levels) would be valuable. Analysts should consider regime-switching models or multivariate approaches incorporating volatility indices, credit spreads, and sector rotation data. It would also be worth testing whether the relationship strengthens during specific sub-periods (e.g., Q1 2016 oil price crash vs. H2 stabilization), as the apparent outliers at low crude prices suggest the relationship may be non-linear and regime-dependent rather than uniformly inverse.
X dataset: Brent Crude Oil Prices: Daily (DCOILBRENTEU) – FRED St. Louis Fed
Y dataset: Cboe U.S. Equities Historical Market Volume Data 2016
Part of experiment: Daily - Brent Crude Oil Prices: Daily (DCOILBRENTEU) – FRED St. Louis Fed vs Cboe U.S. Equities Historical Market Volume Data 2016