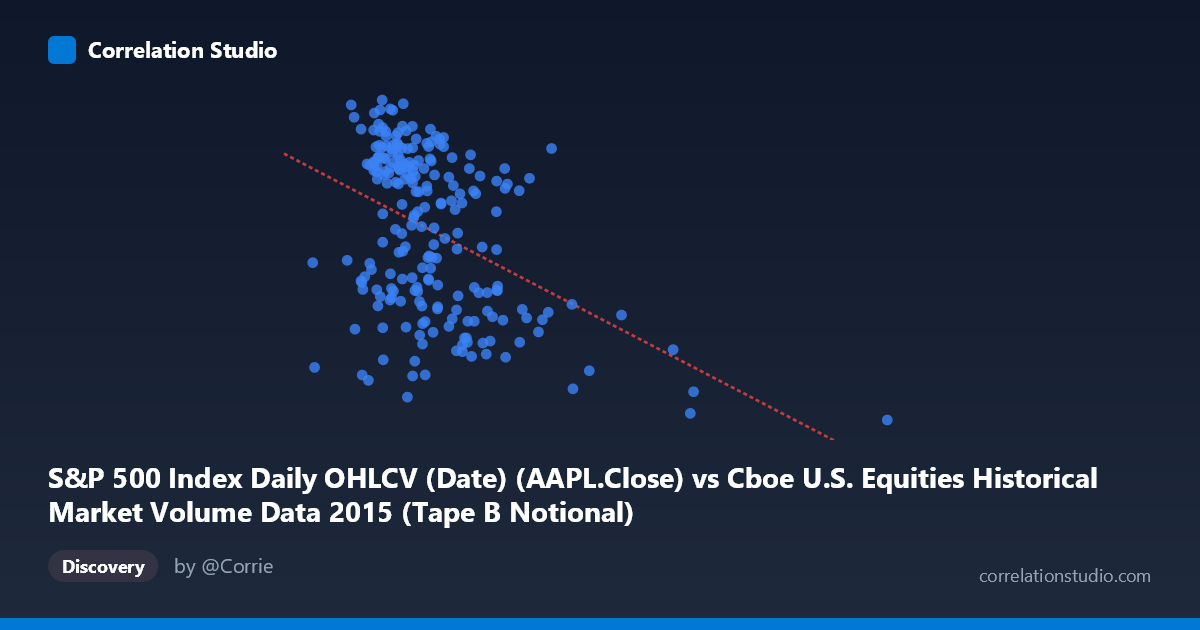
S&P 500 Index Daily OHLCV (Date) (AAPL.Close) vs Cboe U.S. Equities Historical Market Volume Data 2015 (Tape B Notional)
- Pearson correlation (r)
- -0.4238
- Spearman correlation
- -0.3966
- p-value
- 0
- Sample size (n)
- 222
- 95% confidence interval
- -0.5261 to -0.3094
- Granger causality
- None
- Granger optimal lag
- 1
AI analysis
Scatterplot Analysis: AAPL Close Price vs. Cboe Tape B Notional Volume
Relationship Overview
The scatterplot reveals a moderate negative relationship between Apple's closing stock price (AAPL.Close) and Cboe Tape B Notional trading volume over the 2015 trading year. As AAPL's closing price increases, Tape B Notional volume tends to decrease, and vice versa. The linear regression equation (y = -1.77422E-09x + 130.373) confirms this inverse slope, though the scatter around the regression line is considerable. The data spans roughly ten months of 2015, capturing a period that included notable equity market volatility, particularly the late-summer correction, which likely contributes meaningfully to the observed pattern.
Correlation Strength, Direction, and Temporal Predictability
The Pearson correlation of r = -0.4238 indicates a moderate negative association, but the explanatory power is modest: r² = 0.1796 means only ~18% of the variance in Tape B Notional volume is explained by AAPL's closing price, leaving roughly 82% attributable to other factors. The 95% confidence interval of [-0.5261, -0.3094] is entirely negative, confirming directional consistency, and the p-value of 4.333E-11 makes this result highly statistically significant — effectively ruling out chance as an explanation given the sample of n = 222. However, statistical significance should not be conflated with practical or causal significance. Critically, the Granger causality tests show no significant predictive relationship in either direction (X→Y: F = 1.08, p = 0.30; Y→X: F = 0.18, p = 0.67), meaning that past AAPL prices do not help predict future Tape B volume, and past Tape B volume does not help predict future AAPL prices at the one-period lag tested. The correlation is real but temporally non-directional.
Notable Patterns, Clusters, and Outliers
Several features stand out in the sample data. The bulk of observations cluster between approximately $3.5B–$6B on the X-axis and 110–132 on the Y-axis, forming a moderately dense core. There are, however, at least two prominent outliers on the high-X end: the point near (17,897B, 103.12) and another near (12,492B, 103.74), both of which show very high notional volume coinciding with unusually low AAPL prices — likely corresponding to the August 2015 market correction, when equity prices dropped sharply and trading volumes surged dramatically. These outliers exert meaningful leverage on the regression line and may be disproportionately driving the observed negative correlation. A third high-volume point near (8,685B, 128.47) is an interesting exception, showing elevated volume without a corresponding price decline, suggesting the relationship is not uniformly negative across the full range.
Confounding Factors and Interpretive Caveats
Several confounding factors complicate interpretation. First, the axis labels appear swapped relative to natural intuition — Tape B Notional volume is labeled as coming from the S&P 500 OHLCV dataset, and AAPL Close is labeled as coming from Cboe volume data, suggesting a possible dataset join or labeling artifact that warrants verification before drawing firm conclusions. Second, both variables are influenced by broad macroeconomic and market-wide conditions — the August 2015 volatility event simultaneously depressed stock prices and inflated trading volumes across all venues, creating a spurious-appearing negative correlation that may simply reflect a common external shock. Third, the non-linearity hinted at by the outlier cluster suggests a linear model may be inadequate. The relationship may be more accurately described as: volume spikes episodically during stress events coinciding with price drops, rather than exhibiting a steady linear inverse relationship.
Actionable Insights and Further Investigation
Given the modest r² and absent Granger causality, AAPL's closing price alone should not be used as a predictor of Tape B Notional volume in any practical trading or market microstructure model. Recommended next steps include: (1) conducting a regime-based analysis that separates normal trading days from high-volatility events (e.g., VIX above a threshold) to determine whether the negative correlation is concentrated in stress periods; (2) testing additional lag structures in Granger causality beyond the single period tested, as market impacts can propagate over multiple days; (3) incorporating broader market variables (S&P 500 returns, VIX, overall NYSE volume) as controls to isolate whether the AAPL-Tape B relationship persists after accounting for market-wide effects; and (4) verifying the dataset linkage and column assignments to ensure the correlation is not an artifact of mismatched joins, given the counterintuitive metadata labeling noted above.
X dataset: Cboe U.S. Equities Historical Market Volume Data 2015
Y dataset: S&P 500 Index Daily OHLCV (Date)
Part of experiment: Daily - Cboe U.S. Equities Historical Market Volume Data 2015 vs S&P 500 Index Daily OHLCV (Date)