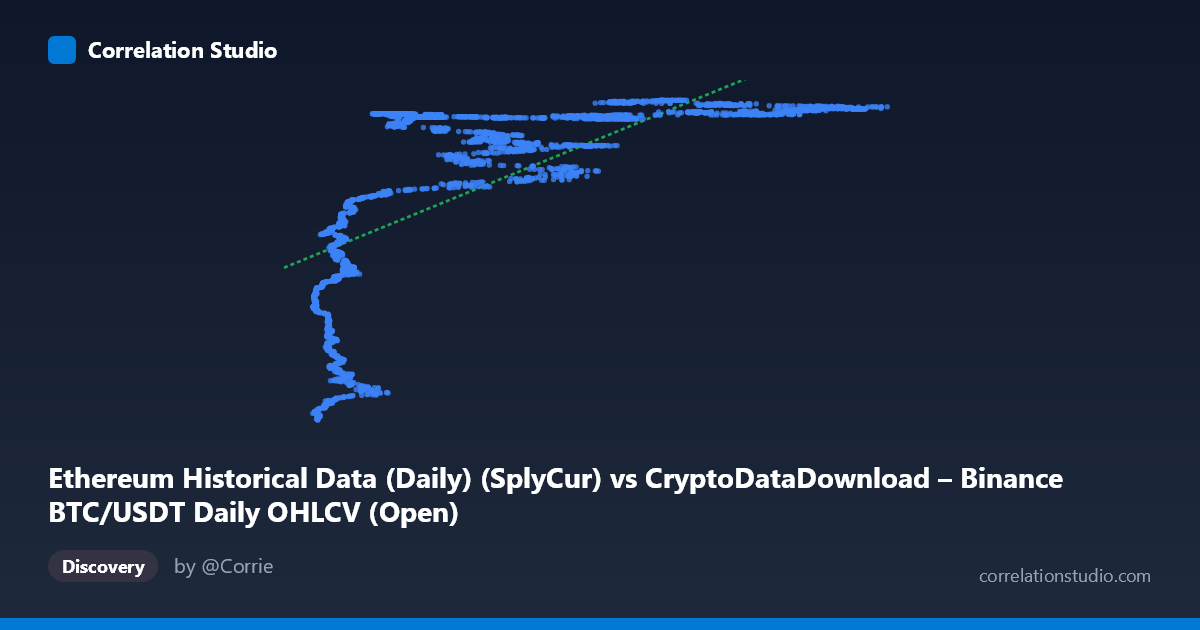
Ethereum Historical Data (Daily) (SplyCur) vs CryptoDataDownload – Binance BTC/USDT Daily OHLCV (Open)
- Pearson correlation (r)
- 0.6737
- Spearman correlation
- 0.8229
- p-value
- 0
- Sample size (n)
- 3191
- 95% confidence interval
- 0.6543 to 0.6923
- Granger causality
- None
- Granger optimal lag
- 10
AI analysis
Analysis of Ethereum Supply vs. Bitcoin Opening Price Relationship
1. Overview of the Relationship
This scatterplot compares Ethereum's circulating supply (X-axis) against Bitcoin's daily opening price on Binance (Y-axis) over a period spanning August 2017 to May 2026. Despite being drawn from two different assets and metrics, the data reveals a positive, moderately strong association: as ETH supply has grown over time, BTC's opening price has also generally trended upward. However, the relationship is clearly non-linear, as evidenced by the sample points and the note that Spearman's rank correlation exceeds the Pearson linear correlation — indicating a monotonic but curved relationship rather than a straight-line one.
2. Strength, Direction, and Statistical Confidence
The Pearson correlation coefficient (r = 0.674) indicates a moderate-to-strong positive linear relationship, but the r² value of 0.454 tells the more important story: only 45% of the variance in Y is explained by X in a linear framework, leaving over half of the variability unaccounted for by this simple model. The 95% confidence interval [0.654, 0.692] is tight, reflecting the large sample size (n=3,191) and giving high statistical confidence that the true correlation lies in this range — the p-value of ~0 confirms this relationship is highly unlikely to be due to chance. However, statistical significance should not be conflated with strength or causality: the Granger causality tests show no significant predictive direction in either direction (X→Y: p=0.93; Y→X: p=0.37), meaning neither variable's history reliably forecasts the other's future values at the tested lags. This strongly suggests the correlation is driven by a shared underlying trend (e.g., both assets/metrics generally rising over the 2017-2026 window) rather than any direct causal or lead-lag mechanism between ETH supply and BTC price.
3. Notable Patterns and Non-Linear Features
The sample points reveal a distinctive stepped or saturating pattern: at low ETH supply values (~3,000-15,000), Y values cluster tightly in a lower band (~94-113 million), but the relationship flattens dramatically at higher X values (~20,000+), where Y plateaus around 118-121 million with much less spread. This is characteristic of a logarithmic or square-root relationship rather than linear — Y rises steeply early on and then levels off, consistent with the note recommending a logarithmic or polynomial fit. There also appears to be a cluster/regime shift around X≈15,000-20,000 where Y jumps from the 96-113M range to the 118-121M range rather quickly, suggesting a possible structural break or regime change in the data (likely corresponding to a specific calendar period rather than a smooth functional transition).
4. Confounding Factors and Caveats
The most critical caveat is that X is not truly "Ethereum supply" as an independent driver of Bitcoin price — both variables are essentially proxies for elapsed time (ETH circulating supply increases monotonically, and BTC price has trended upward over the 2017-2026 period due to broader crypto market growth). This makes the correlation likely spurious or trend-driven rather than reflecting any genuine economic relationship between the two metrics. Additional confounders include shared macro drivers (crypto market sentiment, regulatory events, halving cycles, dollar liquidity conditions) that simultaneously affect both BTC and ETH markets, unrelated to ETH's coin issuance schedule. The lack of Granger causality reinforces that this is not a leading indicator relationship, and the mismatch between N (3,212) and n (3,191) suggests some missing/misaligned data points that could introduce minor bias.
5. Recommendations for Further Investigation
Given the clear non-linearity, analysts should re-fit the model using a logarithmic transformation of X (or a polynomial/spline fit) to better capture the saturating relationship, which should substantially improve explained variance beyond the current 45%. More importantly, since X is fundamentally a time-proxy, a more meaningful analysis would detrend both series (e.g., using year-over-year returns, or differencing) before computing correlation, to test whether genuine co-movement exists independent of the shared upward trend — the Granger results already hint this may vanish once trend is removed. Finally, replacing ETH supply with a more economically meaningful variable (e.g., ETH price, network activity, or gas fees) would yield a more interpretable and actionable comparison against BTC price than using a monotonically increasing supply metric as a predictor.
X dataset: CryptoDataDownload – Binance BTC/USDT Daily OHLCV
Y dataset: Ethereum Historical Data (Daily)
Part of experiment: Bitcoin - CryptoDataDownload – Binance BTC/USDT Daily OHLCV vs Ethereum Historical Data (Daily)