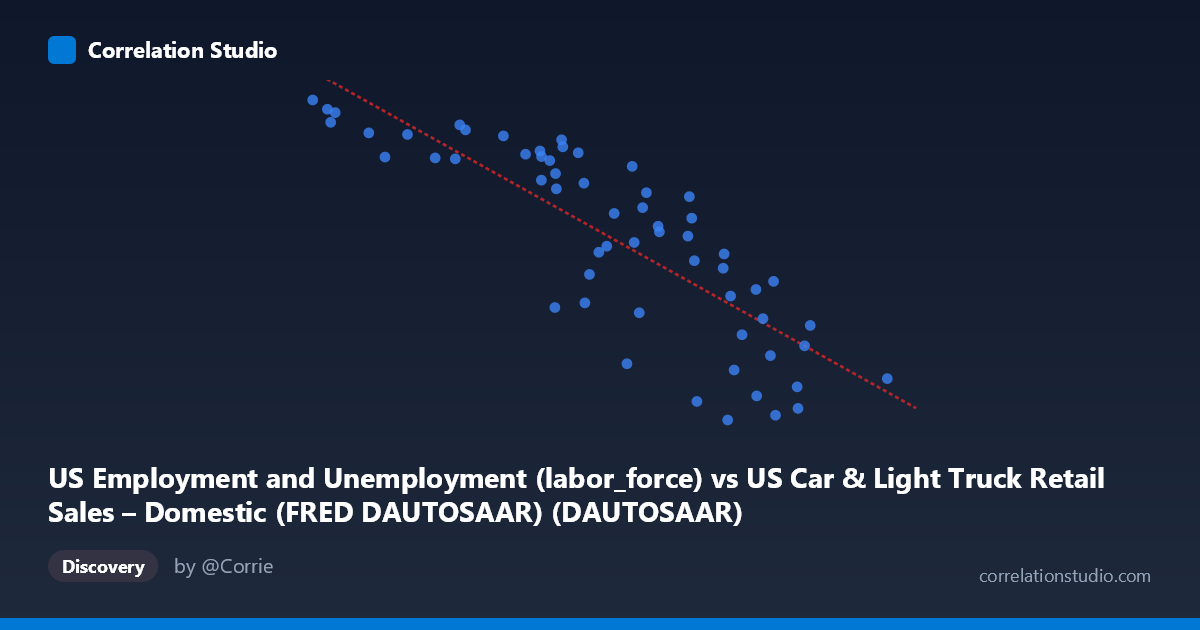
US Employment and Unemployment (labor_force) vs US Car & Light Truck Retail Sales – Domestic (FRED DAUTOSAAR) (DAUTOSAAR)
- Pearson correlation (r)
- -0.8273
- Spearman correlation
- -0.8732
- p-value
- 0
- Sample size (n)
- 59
- 95% confidence interval
- -0.894 to -0.7247
- Granger causality
- None
- Granger optimal lag
- 10
- Time coverage
- 1967-01-01 to 2025-01-01
- Recomputed on refreshed data
- 2026-10-20 (r was -0.8272)
AI analysis
Analysis: US Labor Force vs. Domestic Auto Retail Sales (1967–2025)
Relationship Overview
The scatterplot reveals a moderately strong negative linear relationship between domestic auto retail sales (X-axis, in millions of units SAAR) and the US labor force size (Y-axis). As auto sales increase, labor force participation appears to decline, and vice versa. The fitted regression line (y = -11,320.5x + 200,249) slopes clearly downward across the data range of approximately 1.86 to 10.14 million units in sales, corresponding to labor force values spanning roughly 77,347 to 170,807 (thousands). This inverse relationship is visually apparent and statistically robust, though its interpretation requires careful economic contextualization given the counterintuitive direction.
Correlation Strength and Statistical Significance
The Pearson correlation of r = -0.827 indicates a strong negative association, and the R² of 0.684 means that approximately 68.4% of the variance in labor force size is statistically explained by variation in auto sales — a substantial proportion for macroeconomic data of this nature. The 95% confidence interval for r spans [-0.894, -0.725], which is reassuringly narrow and does not cross zero, confirming the effect is real and consistently estimated. The p-value of 6.66 × 10⁻¹⁶ is extraordinarily small, effectively ruling out chance as an explanation for the observed association. However — and this is critically important — the Granger causality tests show no significant predictive directionality in either direction (X→Y: F = 0.97, p = 0.49; Y→X: F = 1.69, p = 0.13). Despite the strong correlation, neither variable temporally predicts the other at the optimal 10-period lag, which strongly cautions against interpreting this as a causal or even leading-indicator relationship.
Notable Patterns, Clusters, and Outliers
The data exhibits several interesting structural features. There is a loose upper-left cluster of points with low auto sales (X ~ 1.86–3.5) and very high labor force values (Y ~ 154,000–171,000), likely corresponding to economic recession periods (e.g., 2008–2010, early COVID-era) when auto sales collapsed while labor force counts were still near peak levels. Conversely, a lower-right cluster around X ~ 8–10 with Y ~ 77,000–105,000 likely reflects earlier decades (1970s–1980s) when auto sales were robust but the labor force was considerably smaller. Two specific points — (1.86, 170,807) and (2.07, 168,106) — stand out as potential outliers at the extreme low-sales, high-labor-force corner, possibly representing the acute 2009 or 2020 auto market collapse. The relationship also appears to show mild non-linearity in the mid-range (X ~ 5–8), where residual scatter is notably higher, suggesting that a simple linear model may be slightly misspecified across the full historical range.
Confounding Factors and Interpretive Caveats
The most important caveat here is that both variables are primarily driven by a shared underlying factor: time and long-run demographic trends. The US labor force has grown substantially since the 1960s due to population growth, women's labor force entry, and immigration — trends that are largely independent of auto demand. Meanwhile, domestic auto sales have been on a long secular decline relative to earlier decades, partly due to market share losses to foreign manufacturers (not captured in domestic-only DAUTOSAAR data) and structural changes in vehicle ownership. What appears as a negative correlation between these two series is very likely a spurious long-run correlation driven by opposite secular trends rather than any genuine economic mechanism linking labor supply to auto demand. The annual aggregation further masks cyclical dynamics, and the dataset's mismatch — N=86 population with only n=59 paired observations — warrants attention for potential sampling artifacts.
Actionable Insights and Further Investigation
Given these caveats, the most productive next steps would be to detrend both series (e.g., using first differences, HP filter, or percent-change transformations) to isolate cyclical rather than secular relationships before drawing conclusions. Researchers should also consider incorporating total auto sales (domestic + imports) rather than domestic-only figures to better capture consumer demand. A multivariate model controlling for GDP growth, interest rates, and unemployment rate would help isolate whether any genuine labor-market-to-auto-demand relationship exists at business cycle frequencies. The Granger causality null result is actually informative for policy: it suggests that auto sales data should not be used as a leading indicator of labor force trends, nor vice versa, at least at the tested lag structures. Finally, breaking the analysis into pre/post-2008 sub-periods could reveal whether the relationship has changed structurally following the Great Recession and the COVID-19 shock.
X dataset: US Car & Light Truck Retail Sales – Domestic (FRED DAUTOSAAR)
Y dataset: US Employment and Unemployment
Part of experiment: Yearly - US Car & Light Truck Retail Sales – Domestic (FRED DAUTOSAAR) vs US Employment and Unemployment