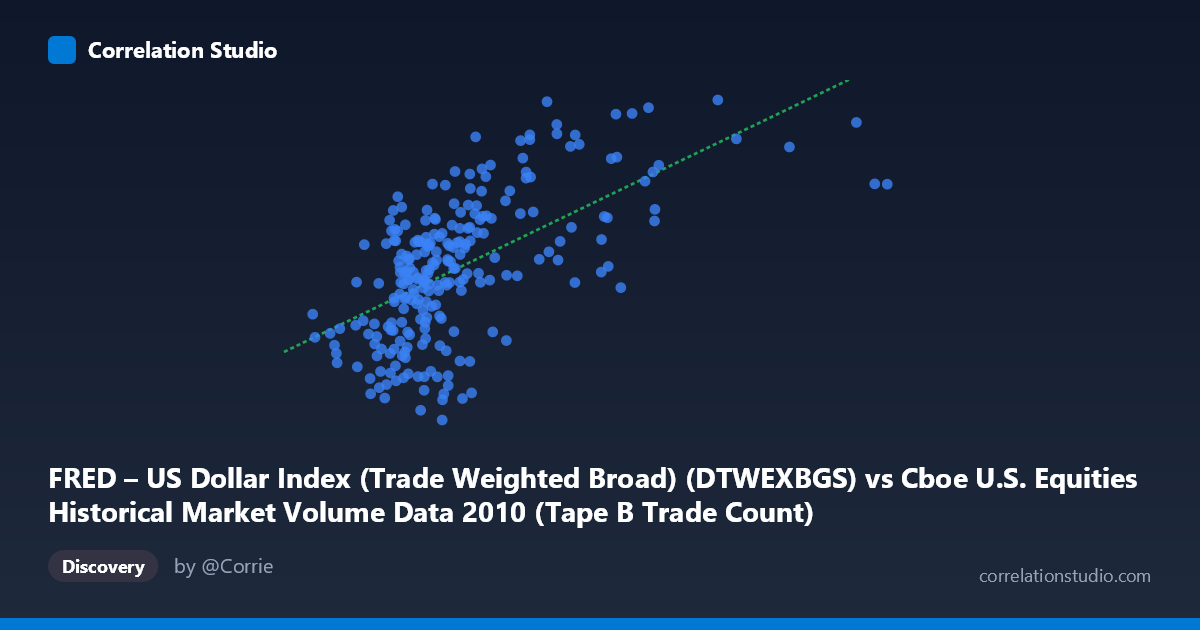
FRED – US Dollar Index (Trade Weighted Broad) (DTWEXBGS) vs Cboe U.S. Equities Historical Market Volume Data 2010 (Tape B Trade Count)
- Pearson correlation (r)
- 0.6053
- Spearman correlation
- 0.6064
- p-value
- 0
- Sample size (n)
- 245
- 95% confidence interval
- 0.5193 to 0.6791
- Granger causality
- None
- Granger optimal lag
- 1
AI analysis
Scatterplot Analysis: US Dollar Index vs. Cboe Tape B Trade Count (2010)
Relationship Overview
The scatterplot reveals a moderate positive relationship between the US Dollar Index (Trade Weighted Broad) and the Cboe Tape B Trade Count for 2010. As the dollar index increases, trade counts tend to rise as well, with the linear regression equation y = 9.007×10⁻⁶x + 90.31 capturing this upward trend. However, the scatter around the regression line is substantial, indicating that the relationship, while real, is far from deterministic. The data spans a full trading year (January–December 2010), providing reasonable temporal breadth, though the clustering of observations in the lower X range (roughly 95,000–400,000) versus a sparser right tail suggests the distribution of the dollar index values is right-skewed during this period.
Correlation Strength and Statistical Significance
With r = 0.605 and r² = 0.366, approximately 36.6% of the variance in Tape B Trade Count is explained by the dollar index — a meaningful but far from dominant share, leaving roughly 63% of variation attributable to other factors. The 95% confidence interval for r [0.519, 0.679] is reasonably tight and sits entirely above zero, reinforcing that the correlation is reliably positive rather than a statistical artifact. The p-value of essentially 0 (against N = 3,302) confirms this relationship is highly unlikely to result from chance. That said, Granger causality tests tell a more cautious story: neither direction (X→Y: F = 0.099, p = 0.753; Y→X: F = 2.298, p = 0.131) reaches statistical significance at conventional thresholds, meaning the dollar index does not meaningfully predict future trade counts, nor vice versa. The correlation reflects contemporaneous co-movement, not a leading-lagging predictive relationship.
Notable Patterns, Clusters, and Outliers
Several features stand out visually. The bulk of observations cluster between X = 150,000–450,000 and Y = 90–95, forming a dense core that drives much of the regression fit. A sparse but notable upper-right cluster (X 500,000, Y 95) — including points like (675,997, 97.55), (702,544, 96.51), (431,410, 97.50), and (530,089, 97.17) — suggests episodic conditions where both high dollar index values and elevated trade counts coincide, potentially during periods of market stress or dollar strength events. The extreme rightmost point (918,660, 95.30) appears as a potential outlier in X but does not exhibit an unusually extreme Y value, suggesting it may be a genuine high-volume trading day rather than a data error. At the lower end, several points with relatively high Y values for low X values create mild heteroscedasticity — the variance in Y appears somewhat wider at lower X values.
Confounding Factors and Interpretive Caveats
Several important caveats apply. First, both variables likely share common drivers — macroeconomic events in 2010 (European sovereign debt crisis, Fed policy, risk-on/risk-off cycles) could simultaneously push the dollar higher and increase trading activity, creating a spurious or inflated correlation. Second, the axis labels appear swapped in the dataset metadata (X is labeled as the dollar index from the Cboe dataset, Y as Tape B Trade Count from the FRED dataset), which warrants verification before drawing conclusions. Third, the Granger causality null result at lag 1 day is informative but not exhaustive — longer lags or nonlinear causality frameworks might reveal different dynamics. Finally, Tape B specifically covers regional exchanges, which may respond differently to currency movements than broader market volume metrics, limiting generalizability.
Actionable Insights and Further Investigation
Practitioners should avoid interpreting this correlation as implying the dollar index drives trade volume in any operational or tradable sense, given the absence of Granger causality. Instead, the co-movement likely signals shared sensitivity to macro regime shifts, making it more useful as a risk monitoring signal than a predictive tool. For further investigation: (1) decompose the time series by event periods (e.g., peak European crisis months in May 2010) to test whether the correlation is regime-dependent; (2) test longer Granger lags (5, 10, 22 days) to capture slower-moving institutional responses; (3) include control variables such as VIX, S&P 500 returns, or Fed balance sheet data to partial out shared macro confounders; and (4) compare Tape B to Tape A and C to assess whether the dollar–volume relationship is exchange-specific or market-wide.
X dataset: Cboe U.S. Equities Historical Market Volume Data 2010
Y dataset: FRED – US Dollar Index (Trade Weighted Broad)
Part of experiment: Daily - Cboe U.S. Equities Historical Market Volume Data 2010 vs FRED – US Dollar Index (Trade Weighted Broad)