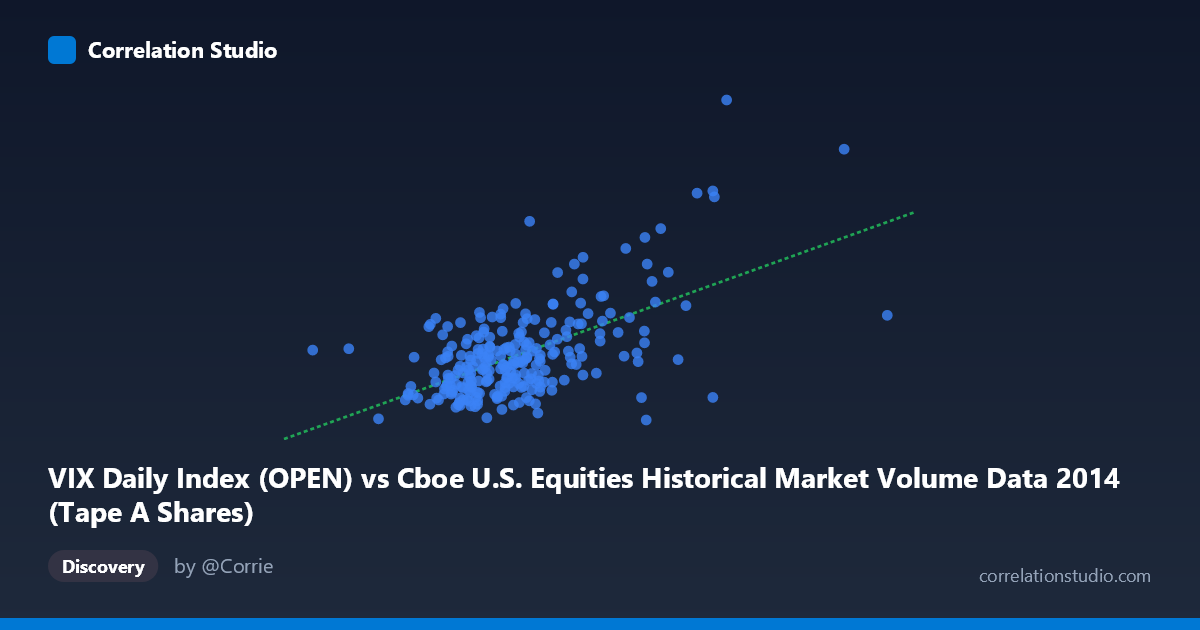
VIX Daily Index (OPEN) vs Cboe U.S. Equities Historical Market Volume Data 2014 (Tape A Shares)
- Pearson correlation (r)
- 0.5836
- Spearman correlation
- 0.4572
- p-value
- 0
- Sample size (n)
- 252
- 95% confidence interval
- 0.4958 to 0.6596
- Granger causality
- None
- Granger optimal lag
- 1
AI analysis
Scatterplot Analysis: Cboe Market Volume vs. VIX Daily Index (2014)
Overall Relationship and Visualization
The scatterplot reveals a moderate positive relationship between Cboe U.S. Equities daily market volume (X-axis) and the VIX Daily Index open values (Y-axis) across 252 trading days in 2014. As market volume increases, VIX values tend to rise, which aligns intuitively with the well-established financial principle that heightened trading activity often accompanies elevated market uncertainty or fear. The linear regression equation (y = 3.36×10⁻⁸x + 6.49) confirms this positive slope, though the wide scatter around the regression line is immediately apparent, suggesting that volume alone is far from a complete predictor of VIX levels. The data cloud shows a general upward trend but with considerable dispersion, particularly at mid-range volume values.
Correlation Strength and Statistical Interpretation
The Pearson correlation of r = 0.5836 indicates a moderate positive association, but the coefficient of determination (r² = 0.3406) is the more sobering figure — it means that only ~34% of the variance in VIX is explained by market volume, leaving roughly two-thirds of VIX variability attributable to other factors entirely. The 95% confidence interval of [0.4958, 0.6596] is meaningfully narrow given the sample size of n = 252, and the p-value of effectively zero confirms this correlation is statistically robust and not a sampling artifact. However, the Granger causality results tell a critical story: neither direction of temporal prediction is significant (X→Y: F = 1.20, p = 0.27; Y→X: F = 0.19, p = 0.66). This means that despite the contemporaneous correlation, past values of market volume do not help predict future VIX, and vice versa — the relationship is associative, not predictively directional in a temporal sense.
Notable Patterns, Clusters, and Outliers
Several features stand out in the data. The bulk of observations cluster in the 180M–280M volume range with VIX values between 11–17, forming a relatively dense core. However, there are clear high-leverage outliers in the upper right quadrant — most notably the point near (362M volume, VIX 29.26) and another near (355M, VIX 23.55), which correspond almost certainly to the October 2014 volatility spike, a well-documented period of sharp market turbulence. These extreme points likely exert disproportionate influence on the correlation coefficient, inflating r upward. Conversely, the point at approximately (312M, VIX 10.40) is a notable counter-example — high volume with very low volatility — suggesting that volume spikes can occur in calm, high-liquidity environments as well as fearful ones. The non-linear impression of the scatter also hints that the relationship may strengthen only at extreme volume levels.
Confounding Factors and Interpretive Caveats
Several important caveats apply. First, the October 2014 outlier cluster likely drives a substantial portion of the correlation — removing those points could meaningfully reduce r, so the relationship may not be as stable across normal trading conditions. Second, reverse causality is plausible: elevated VIX (i.e., fear) may drive volume as investors hedge and rebalance, rather than volume causing volatility. Third, omitted variables such as macroeconomic announcements (Fed meetings, jobs reports), geopolitical events, options expiration cycles, and algorithmic trading activity all independently influence both variables, creating spurious correlation through shared external drivers. Fourth, the data covers only a single calendar year (2014), limiting generalizability — 2014 was characterized by a prolonged low-volatility regime punctuated by a single sharp spike, which is not representative of all market environments.
Actionable Insights and Further Investigation
Practitioners should resist using market volume alone as a VIX forecasting tool given the absence of Granger causality and the limited variance explained. More productive directions would include: (1) testing whether options volume specifically (rather than total equities volume) shows stronger or causally directional relationships with VIX, as options activity is mechanistically linked to VIX computation; (2) applying a regime-based analysis separating low-volatility periods from stress periods to determine whether the relationship strengthens nonlinearly during market dislocations; (3) incorporating lagged macroeconomic variables as controls to partial out shared external drivers; and (4) extending the analysis across multiple years to assess whether the 2014 findings replicate across different volatility regimes. A log transformation of both variables may also better capture the likely multiplicative rather than additive nature of this relationship.
X dataset: Cboe U.S. Equities Historical Market Volume Data 2014
Y dataset: VIX Daily Index
Part of experiment: Daily - Cboe U.S. Equities Historical Market Volume Data 2014 vs VIX Daily Index