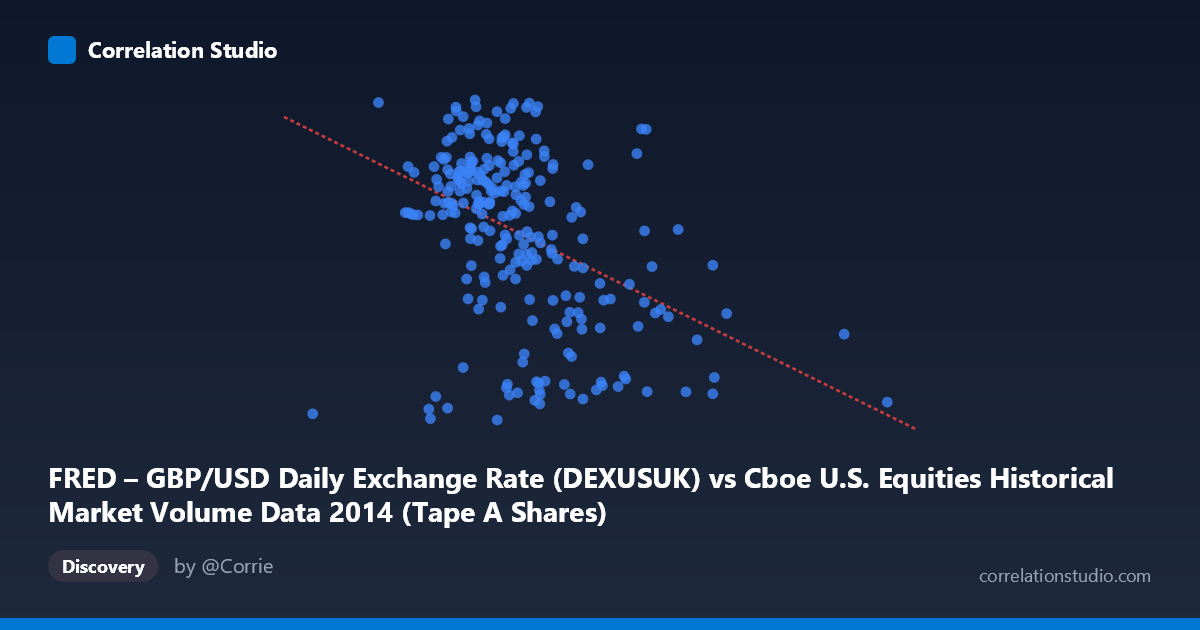
FRED – GBP/USD Daily Exchange Rate (DEXUSUK) vs Cboe U.S. Equities Historical Market Volume Data 2014 (Tape A Shares)
- Pearson correlation (r)
- -0.4188
- Spearman correlation
- -0.4134
- p-value
- 0
- Sample size (n)
- 249
- 95% confidence interval
- -0.5163 to -0.3107
- Granger causality
- None
- Granger optimal lag
- 1
AI analysis
Analysis: GBP/USD Exchange Rate vs. U.S. Equities Market Volume (2014)
Relationship Overview The scatterplot reveals a modest negative relationship between U.S. equities market volume (X-axis, measured in shares traded on Tape A) and the GBP/USD daily exchange rate (Y-axis). As market volume increases, the pound tends to trade at a slightly lower value against the dollar. The linear regression equation (y = -4.03×10⁻¹⁰x + 1.741) confirms this downward slope, though the relationship is far from deterministic. The data cloud is broadly dispersed, with no tight clustering around the regression line, suggesting that while a statistical pattern exists, volume alone is a weak predictor of the exchange rate in isolation.
Correlation Strength and Statistical Significance The correlation coefficient of r = -0.419 indicates a weak-to-moderate negative association. Critically, r² = 0.175 means that only 17.5% of the variance in GBP/USD is explained by equities market volume — leaving roughly 82.5% attributable to other factors entirely. The 95% confidence interval of [-0.516, -0.311] is meaningfully below zero throughout, and the p-value of 5.36×10⁻¹² confirms this is highly unlikely to be a chance result given the sample size (n = 249, population N = 3,686). However, statistical significance here is partly a function of large sample size rather than a strong practical effect. Most importantly, Granger causality analysis finds no significant predictive direction in either direction (X→Y: F = 0.237, p = 0.627; Y→X: F = 0.275, p = 0.600), meaning that past volume does not help forecast future exchange rates, and vice versa. The correlation, while real, appears contemporaneous and associative rather than temporally predictive.
Notable Patterns and Outliers The data points cluster most densely in the volume range of approximately 190–270 million shares, with GBP/USD values between 1.62 and 1.70. Several notable outliers deserve attention: points at very high volumes (approaching 300–460 million shares) tend to correspond with lower exchange rate readings (around 1.57–1.60), pulling the regression line downward and partly driving the negative correlation. Conversely, a handful of high-volume days with relatively elevated GBP/USD values (e.g., ~1.70–1.72 at moderate volumes) suggest the relationship is inconsistent. The Y-axis range is narrow (1.55–1.72), meaning even visually prominent vertical spread represents only about 10% variation in the exchange rate, which limits the practical magnitude of any detected effect.
Confounding Factors and Caveats This correlation should be interpreted with considerable caution. Both variables are driven by broader macroeconomic forces during 2014 — including Federal Reserve tapering decisions, UK economic performance, geopolitical events (notably the Scottish independence referendum in September 2014, which significantly pressured GBP), and global risk sentiment. High-volume equity trading days are often associated with market stress or major news events, which simultaneously tend to strengthen the USD as a safe-haven currency, potentially explaining the observed negative association as a spurious co-movement driven by a common third factor (risk-off sentiment) rather than any direct causal link. The dataset also covers only a single calendar year, limiting generalizability.
Actionable Insights and Further Investigation Given the absence of Granger causality, practitioners should not use equity volume as a leading indicator for GBP/USD trading signals. However, the contemporaneous correlation warrants further investigation into shared drivers. Recommended next steps include: (1) controlling for known confounders such as VIX (volatility index) or risk-appetite proxies to test whether the correlation disappears; (2) segmenting the data around known macro events in 2014 (e.g., the September Scottish referendum) to determine if outlier clusters are event-driven; (3) extending the analysis across multiple years to assess whether the negative correlation is structurally persistent or an artifact of 2014's specific market conditions; and (4) exploring whether specific exchange subsets (beyond Tape A) show stronger or weaker associations, which could help isolate whether the effect is volume-specific or market-wide.
X dataset: Cboe U.S. Equities Historical Market Volume Data 2014
Y dataset: FRED – GBP/USD Daily Exchange Rate
Part of experiment: Daily - Cboe U.S. Equities Historical Market Volume Data 2014 vs FRED – GBP/USD Daily Exchange Rate