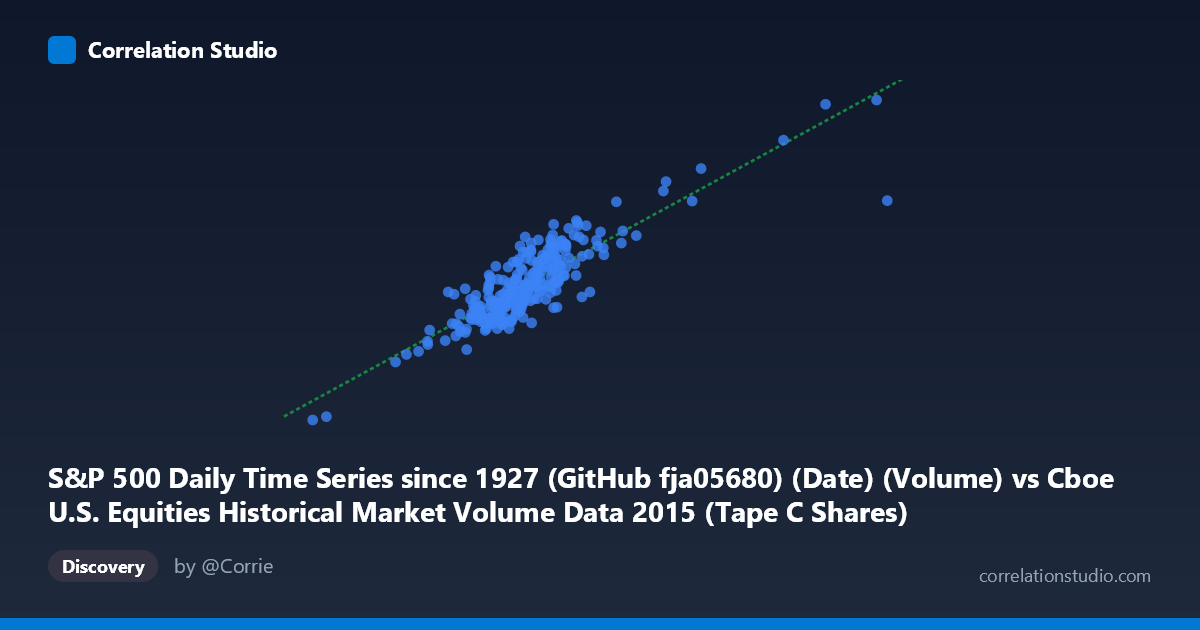
S&P 500 Daily Time Series since 1927 (GitHub fja05680) (Date) (Volume) vs Cboe U.S. Equities Historical Market Volume Data 2015 (Tape C Shares)
- Pearson correlation (r)
- 0.8677
- Spearman correlation
- 0.8124
- p-value
- 0
- Sample size (n)
- 252
- 95% confidence interval
- 0.8334 to 0.8952
- Granger causality
- None
- Granger optimal lag
- 10
AI analysis
Analysis: S&P 500 Daily Volume vs. Cboe Tape C Shares (2015)
Relationship Overview The scatterplot reveals a strong positive linear relationship between total U.S. equity market volume (S&P 500 daily volume, X-axis) and Cboe Tape C share volume (Y-axis) across 252 trading days in 2015. As overall market volume increases, Tape C shares traded rise proportionally, which is intuitive given that Tape C represents a significant structural component of total U.S. equity trading activity. The linear regression equation (y = 21.38x + 5.65×10⁸) suggests that for every additional share of total market volume, Tape C shares increase by roughly 21 units, with a substantial baseline floor around 565 million shares — reflecting the persistent, non-zero baseline of Tape C activity regardless of broader market conditions.
Correlation Strength and Statistical Significance The correlation is strong and statistically robust: r = 0.868 with a tight 95% confidence interval of [0.833, 0.895], leaving little uncertainty about the direction or approximate magnitude of the association. The R² of 0.753 is particularly meaningful — it indicates that approximately 75.3% of the day-to-day variance in Tape C share volume is explained by total market volume, a substantial explanatory share for financial market data. The p-value of essentially zero, combined with a sample of 252 paired observations drawn from a population of 3,302, confirms this is not a chance finding. However, the Granger causality tests tell a more cautious story: neither direction (X→Y nor Y→X) achieves statistical significance at the optimal 10-period lag (F = 0.68, p = 0.74 and F = 0.49, p = 0.90, respectively). This means that while the two series move together strongly in a contemporaneous sense, neither reliably predicts the other in a forward-looking temporal framework — the correlation is synchronous rather than directional.
Patterns, Clusters, and Outliers The bulk of observations cluster tightly in a central band, roughly between 110M–170M shares (X) and 2.5B–4.5B shares (Y), consistent with typical 2015 trading conditions. There are two visually distinct regions worth noting: a lower-left outlier cluster anchored by what appears to be an unusually low-volume day (near 54M total volume / 1.41B Tape C shares — likely a holiday-adjacent half-day session), and an upper-right extension featuring several high-volume days exceeding 180M–215M total shares with Tape C volumes approaching 5.0B–5.2B. These upper-right points likely correspond to August 2015 volatility episodes (the flash correction around August 24th), when broad market stress drove volume spikes across all tapes simultaneously. The scatter tightens in the middle range, suggesting the linear model is most reliable under normal market conditions.
Confounding Factors and Caveats Several important caveats apply. First, this correlation is largely structural by construction — Tape C is a subset of total market volume, so a positive relationship is mathematically expected to some degree, and the correlation partly reflects this compositional dependency rather than an independent economic signal. Second, market microstructure changes during 2015 (e.g., shifts in exchange routing, maker-taker fee adjustments, or changes in high-frequency trading activity) could have altered the Tape C share of total volume systematically over the year, introducing non-stationarity. Third, the remaining ~25% unexplained variance likely reflects days where Tape C's share shifted relative to Tape A/B, potentially driven by sector rotation (Tape C covers NYSE Arca-listed securities, heavily weighted toward ETFs and tech), options expiration effects, or index rebalancing events. The absence of Granger causality further cautions against any mechanistic or predictive interpretation.
Actionable Insights and Further Investigation For practitioners, the strong contemporaneous relationship suggests that Tape C volume can serve as a reliable real-time proxy for overall market activity under normal conditions, but the lack of Granger causality means it should not be used as a leading indicator for total volume forecasting. Further investigation should include: (1) decomposing the residuals by month or volatility regime to assess whether the relationship degrades during stress periods; (2) normalizing Tape C as a share of total volume over time to detect any structural drift in market share across tapes; (3) testing at shorter lags (1–3 days) for Granger causality, as the 10-period optimal lag may be masking shorter-horizon predictive relationships; and (4) extending the dataset beyond 2015 to assess whether this correlation is stable across different rate environments and market structures, or whether 2015 represents a particularly coherent regime.
X dataset: Cboe U.S. Equities Historical Market Volume Data 2015
Y dataset: S&P 500 Daily Time Series since 1927 (GitHub fja05680) (Date)
Part of experiment: Daily - Cboe U.S. Equities Historical Market Volume Data 2015 vs S&P 500 Daily Time Series since 1927 (GitHub fja05680) (Date)