FRED – Corporate Bond Yield (Moody's Aaa) (AAA) vs Brent Crude Oil Prices: Daily (DCOILBRENTEU) – FRED St. Louis Fed (DCOILBRENTEU)
- Pearson correlation (r)
- -0.6673
- Spearman correlation
- -0.7049
- p-value
- 0
- Sample size (n)
- 296
- 95% confidence interval
- -0.7261 to -0.5989
- Granger causality
- None
- Granger optimal lag
- 1
AI analysis
Analysis: Brent Crude Oil Price vs. Moody's Aaa Corporate Bond Yield
Relationship Overview
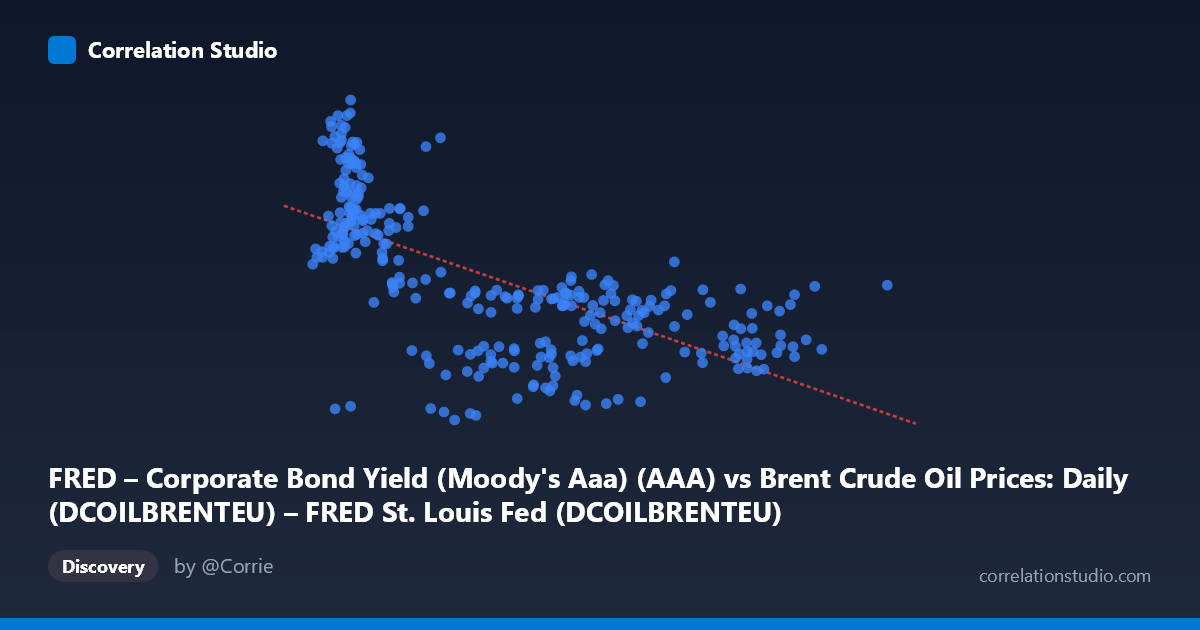
The scatterplot reveals a moderate negative relationship between Brent crude oil prices (X-axis, USD/barrel) and Moody's Aaa corporate bond yields (Y-axis, percent). As oil prices rise, corporate bond yields tend to fall, and vice versa. The linear regression equation (y = -0.0397x + 7.88) captures this inverse trend, predicting roughly a 0.40 percentage point decline in Aaa yields for every $10/barrel increase in crude prices. Visually, the data shows a clear downward-sloping cloud, with the highest bond yields (8–10%) concentrated at low oil prices (roughly $10–$30/barrel), and the lowest yields (2.5–5%) appearing at higher oil prices ($60–$140/barrel). This pattern is largely a temporal artifact: low oil prices dominated the late 1980s–1990s when interest rates were high, while high oil prices and historically low yields coexisted during the 2000s–2020s era of monetary easing.
Correlation Strength and Statistical Significance
The Pearson correlation of r = -0.667 indicates a moderate-to-strong negative association, and with N = 1,288 monthly observations over nearly four decades, the result is highly statistically significant (p ≈ 0). The 95% confidence interval of [-0.726, -0.599] is relatively tight, confirming the direction and magnitude are well-estimated. However, R² = 0.445 tells a more sobering story: crude oil prices explain only 44.5% of the variance in Aaa bond yields, meaning the majority of yield variation (~55.5%) is driven by factors entirely outside this model. The linear fit is useful as a broad descriptor but far from sufficient for precise prediction. Critically, Granger causality tests find no significant directional predictive relationship in either direction (X→Y: F = 0.669, p = 0.414; Y→X: F = 0.036, p = 0.849). This strongly suggests that while the two variables move together statistically, neither reliably predicts the other's future values at a 1-period lag — the correlation reflects shared macroeconomic history, not a mechanistic causal link.
Notable Patterns, Clusters, and Outliers
The scatterplot exhibits at least two visually distinct clusters. The first occupies low X values ($10–$35/barrel) with high Y values (7–10%), corresponding to pre-2000 data when oil was cheap and interest rates were elevated. The second cluster spans higher oil prices ($50–$140/barrel) with yields compressed in the 2–6% range, reflecting post-2000 and post-2008 dynamics. There is a notable vertical spread at low oil prices, where yields range from ~6% to nearly 10.5% even within a narrow $10–$25 range — suggesting bond yields were responding to many other forces during those years. A few outliers exist at extremely high oil prices ($110/barrel) with bond yields still relatively modest (~3.5–4%), consistent with the 2011–2014 period of quantitative easing. The relationship also appears non-linear: the rate of yield decline with rising oil prices seems to flatten at higher price levels, suggesting a logarithmic or segmented fit might outperform the linear model.
Confounding Factors and Caveats
This correlation is almost certainly spurious in a causal sense, driven by a shared third variable: the secular decline of global interest rates from the late 1980s through the 2020s. Central bank policy (especially post-2008 QE), demographic trends, and global savings gluts systematically suppressed bond yields over this period. Simultaneously, oil prices were on a long upward trend through the mid-2000s. Both series are therefore primarily reflections of their own independent macroeconomic and monetary trajectories that happen to share a time dimension. Additionally, oil price dynamics are driven by geopolitical events, OPEC supply decisions, and demand cycles, while Aaa bond yields respond to Fed policy, inflation expectations, and credit conditions — mechanisms with little direct overlap. The lack of Granger causality at even a 1-period lag reinforces that any predictive cross-variable signal is essentially absent once time-series structure is controlled for.
Actionable Insights and Further Investigation
Given these findings, practitioners should avoid treating this correlation as a forecasting relationship in any direct sense. However, both series serve as excellent macro regime indicators: their joint behavior can help characterize broad economic environments (e.g., high-oil/low-yield regimes vs. low-oil/high-yield regimes). Further investigation should include: (1) controlling for time explicitly using detrended or first-differenced series to isolate genuine co-movement from shared trends; (2) testing non-linear model specifications (log-linear or piecewise regression) given the apparent curvature; (3) extending Granger causality testing to longer lags (e.g., 3–12 periods) to check for delayed transmission effects; and (4) introducing mediating variables such as CPI inflation, Fed Funds Rate, or global GDP growth to assess whether the oil-yield relationship survives partial correlation analysis. A regime-switching model separating pre- and post-2000 data could also reveal whether the relationship has changed structurally over time.
X dataset: Brent Crude Oil Prices: Daily (DCOILBRENTEU) – FRED St. Louis Fed
Y dataset: FRED – Corporate Bond Yield (Moody's Aaa)
Part of experiment: Daily - Brent Crude Oil Prices: Daily (DCOILBRENTEU) – FRED St. Louis Fed vs FRED – Corporate Bond Yield (Moody's Aaa)