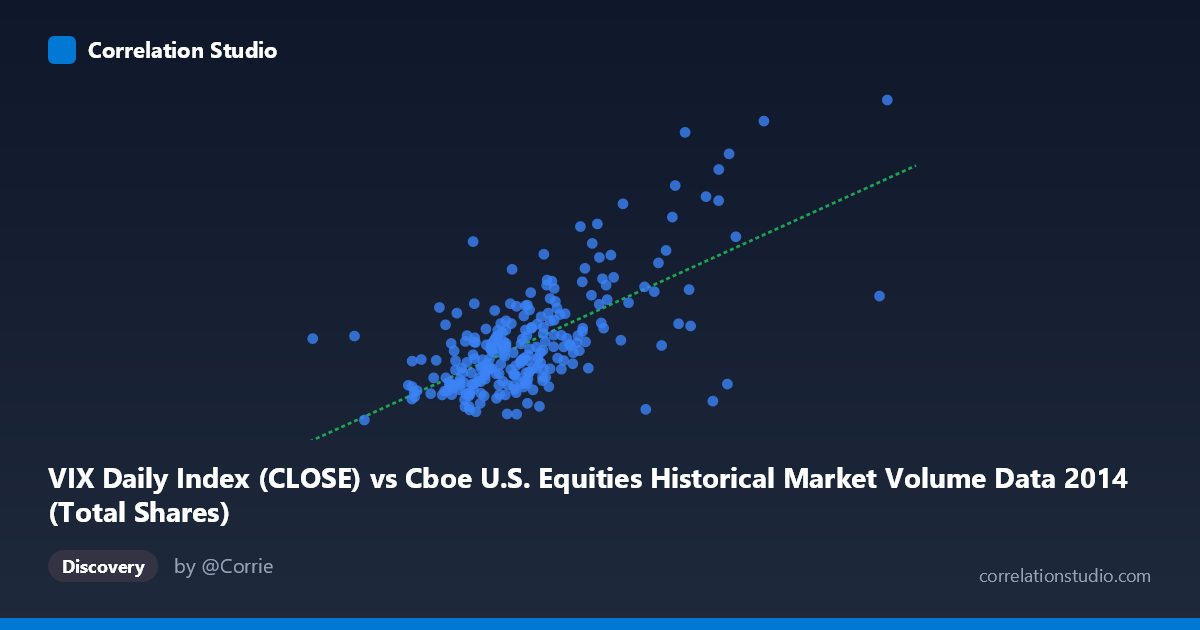
VIX Daily Index (CLOSE) vs Cboe U.S. Equities Historical Market Volume Data 2014 (Total Shares)
- Pearson correlation (r)
- 0.6593
- Spearman correlation
- 0.5718
- p-value
- 0
- Sample size (n)
- 252
- 95% confidence interval
- 0.5832 to 0.7239
- Granger causality
- None
- Granger optimal lag
- 1
AI analysis
Scatterplot Analysis: VIX vs. U.S. Equity Market Volume (2014)
Relationship Overview
The scatterplot reveals a moderately positive relationship between U.S. equity market trading volume (X-axis, measured in total shares) and the CBOE Volatility Index close price (Y-axis, VIX). As daily trading volume increases, VIX levels tend to rise, which aligns intuitively with the well-established financial principle that market stress and uncertainty drive both heightened volatility and elevated trading activity. The linear regression equation (y = 1.979×10⁻⁸x + 5.485) suggests that each additional ~50 million shares traded corresponds to roughly one additional VIX point, though the relationship is clearly not perfectly linear across the full range of observations.
Correlation Strength and Statistical Significance
The Pearson correlation of r = 0.6593 indicates a moderate-to-strong positive association, but the more meaningful figure is r² = 0.4346 — meaning that trading volume explains only about 43.5% of the variance in VIX levels, leaving more than half the variability attributable to other factors. The 95% confidence interval [0.5832, 0.7239] is relatively tight given the large sample (n = 252 paired observations from a population of N = 3,686), and the p-value of effectively zero confirms this is not a chance finding. Critically, however, the Granger causality tests find no significant predictive direction in either direction (X→Y: F = 1.27, p = 0.26; Y→X: F = 0.46, p = 0.50). This means that knowing today's volume does not reliably help predict tomorrow's VIX, and vice versa — the correlation reflects co-movement rather than temporal predictive leverage, an important distinction for any trading or risk management application.
Patterns, Clusters, and Outliers
Several structural features stand out in the sampled data. The bulk of observations cluster in a relatively compact zone between approximately 350–500 million shares and VIX values of 11–16, suggesting a "normal regime" for 2014 market conditions. However, there are clear high-leverage outliers at elevated volume and VIX levels — notably points near (710M shares, 25.2 VIX) and (670M shares, 23.6 VIX) — which likely correspond to specific volatility episodes in mid-to-late 2014 (consistent with the October 2014 market selloff). There also appears to be a non-linear characteristic: at very high volumes, VIX values spike disproportionately, suggesting a possible threshold or regime-shift effect rather than a purely linear relationship. One anomalous low point near (575M shares, 10.85 VIX) suggests high volume can occasionally occur without elevated fear, possibly during momentum-driven rallies.
Confounding Factors and Caveats
Several important caveats apply. First, reverse causality is plausible: VIX spikes may cause volume surges as investors rebalance or hedge, making the causal narrative ambiguous — a point reinforced by the failed Granger tests. Second, seasonal effects could confound both variables simultaneously; end-of-quarter rebalancing, options expiration cycles, and low-volume holiday periods in 2014 would independently influence both metrics. Third, the dataset spans only a single calendar year (2014), limiting generalizability — 2014 was a relatively low-volatility year punctuated by a sharp October episode, so results may not replicate in high-volatility regimes like 2008 or 2020. Fourth, the axes appear to be swapped from convention (VIX is typically treated as the independent market signal), which should be verified before drawing directional conclusions.
Actionable Insights and Further Investigation
For practitioners, the moderate correlation and absence of Granger causality suggest that volume alone is insufficient as a VIX predictor in a short-term trading strategy, but the co-movement may still be useful for risk regime classification (e.g., flagging days when both metrics simultaneously breach thresholds). Further investigation should include: (1) segmenting the data by market regime (low/high VIX quartiles) to test whether correlations strengthen during stress periods; (2) incorporating additional variables such as put/call ratios, bid-ask spreads, or S&P 500 returns to build a more complete multivariate model; (3) extending the time series across multiple years to test whether the 2014 relationship is stable; and (4) testing non-linear models (e.g., polynomial or threshold regression) given the apparent curvature at high-volume, high-VIX extremes, where the linear model likely underestimates the true relationship.
X dataset: Cboe U.S. Equities Historical Market Volume Data 2014
Y dataset: VIX Daily Index
Part of experiment: Daily - Cboe U.S. Equities Historical Market Volume Data 2014 vs VIX Daily Index