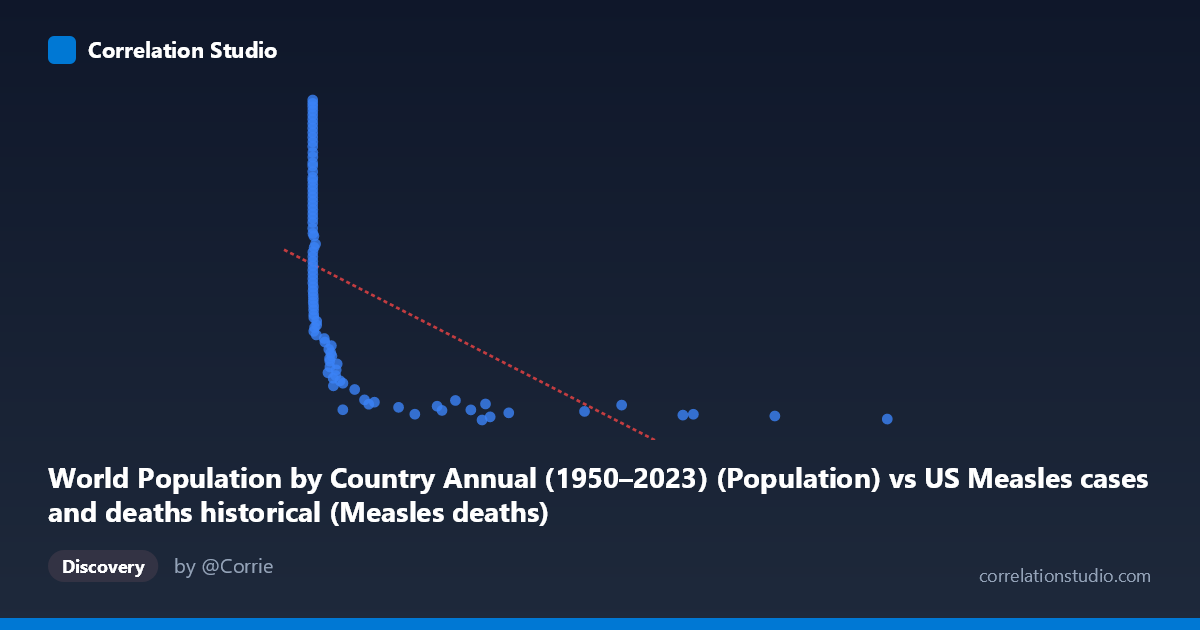
World Population by Country Annual (1950–2023) (Population) vs US Measles cases and deaths historical (Measles deaths)
- Pearson correlation (r)
- -0.5358
- Spearman correlation
- -0.9559
- p-value
- 0
- Sample size (n)
- 94
- 95% confidence interval
- -0.6661 to -0.3737
- Granger causality
- None
- Granger optimal lag
- 10
- Time coverage
- 1919-01-01 to 2022-01-01
- Recomputed on refreshed data
- 2026-10-17 (r was -0.5358)
AI analysis
Analysis of World Population vs. US Measles Deaths (1919–2022)
1. What the Visualization Reveals
The scatterplot displays a negative relationship between world population (X-axis, measured in raw country/world population figures) and US measles deaths (Y-axis), spanning over a century of data from 1919 to 2022. The most visually striking feature is a pronounced L-shaped or hyperbolic curve: measles deaths are extremely high when population values cluster near zero (the left side of the plot), then drop sharply and plateau at lower death counts as population values increase. This pattern immediately suggests the relationship is better described as non-linear — likely logarithmic or power-law — rather than strictly linear, consistent with the note that Spearman ρ exceeds Pearson r.
2. Correlation Strength, Direction, and Causality
The Pearson r of −0.536 indicates a moderate negative correlation, with r² = 0.287 meaning that roughly 28.7% of the variance in US measles deaths is statistically explained by world population. While the p-value of 2.63×10⁻⁸ confirms this is highly statistically significant and unlikely due to chance, the 95% confidence interval of [−0.666, −0.374] is notably wide, reflecting meaningful uncertainty in the precise strength of the relationship. Critically, the Granger causality analysis finds no significant predictive direction in either direction (X→Y: F=1.18, p=0.32; Y→X: F=0.85, p=0.58), meaning that world population does not temporally predict US measles deaths, nor vice versa. This is a crucial caveat: statistical correlation exists, but neither variable demonstrably leads the other in a time-series sense.
3. Notable Patterns, Clusters, and Outliers
Several distinct data clusters are visible. A dense cluster at very low X values (0–500) spans a wide range of Y values from roughly 37 million to 161 million measles deaths, reflecting the early 20th century when measles mortality was high and highly variable. A second cluster at moderate X values (500–4,000) shows markedly reduced death counts concentrated in the 37–70 million range. A third sparse cluster at high X values (6,000–13,000) settles near the floor of measles deaths (~37–43 million), suggesting an asymptotic lower bound. Points like (0, 161,811,336) and (12,992, 37,790,931) represent the extreme anchors of this relationship. The near-zero X values producing maximum Y variance strongly imply that pre-vaccination era years dominate the left side of the chart.
4. Confounding Factors and Interpretive Caveats
The most important caveat is that both variables are primarily driven by time — this is almost certainly a spurious correlation mediated by historical period. US measles deaths declined precipitously due to improved nutrition, healthcare, and especially the introduction of the measles vaccine in 1963, not because world population grew. World population also grew monotonically over this same century. The apparent correlation is largely an artifact of two independent secular trends moving in opposite directions over time. Additionally, the population X-axis values appear unusually distributed (many zeros and very small values alongside values in the thousands), which may reflect data alignment or merging issues between the two datasets — the population figures may not correspond meaningfully to the years in which measles deaths were recorded.
5. Actionable Insights and Further Investigation
Given the likely spurious nature of this correlation, several investigative steps are warranted. First, introduce year as a covariate in a multivariate regression to determine whether the population-deaths relationship persists after controlling for time period. Second, fit a logarithmic or exponential decay model rather than a linear one, given the visual L-shape and the Spearman/Pearson discrepancy — this would likely improve explained variance substantially. Third, verify the dataset alignment: the mixing of US measles data with world population country-level data warrants scrutiny of whether rows are correctly paired by year and geography. Fourth, replacing world population with US-specific population or vaccination coverage rates would be more theoretically defensible. Finally, a segmented analysis splitting pre-1963 (pre-vaccine) and post-1963 data would likely reveal that the apparent relationship dissolves or reverses within each epoch, confirming the confounding role of time.
X dataset: US Measles cases and deaths historical
Y dataset: World Population by Country Annual (1950–2023)
Part of experiment: Yearly - US Measles cases and deaths historical vs World Population by Country Annual (1950–2023)