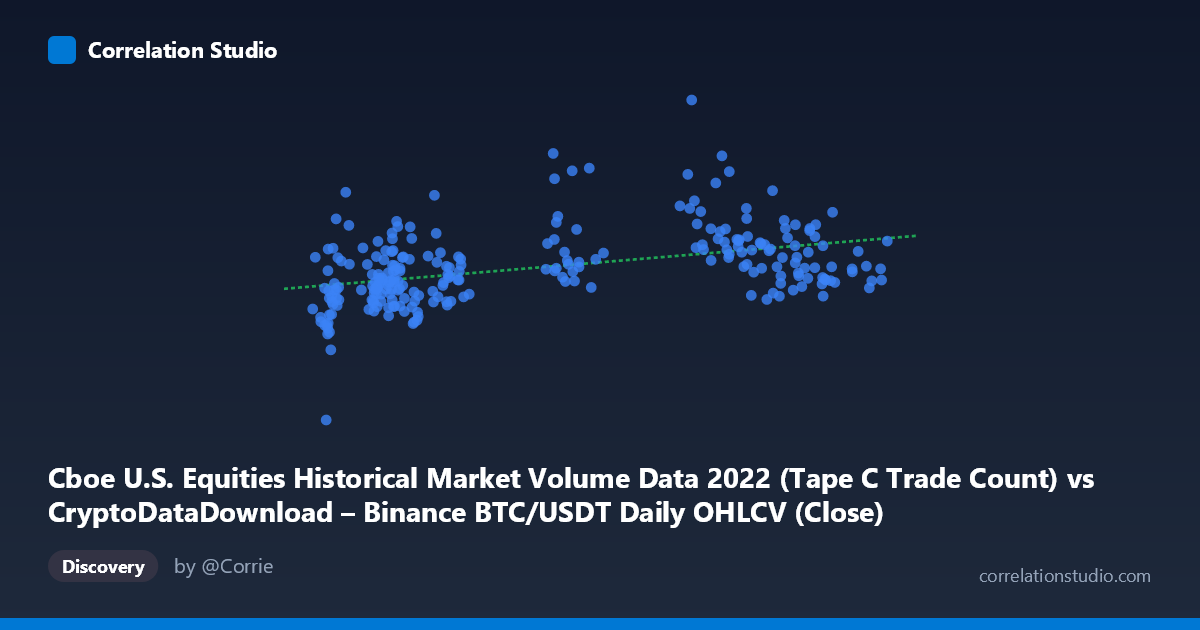
Cboe U.S. Equities Historical Market Volume Data 2022 (Tape C Trade Count) vs CryptoDataDownload – Binance BTC/USDT Daily OHLCV (Close)
- Pearson correlation (r)
- 0.4194
- Spearman correlation
- 0.4573
- p-value
- 0
- Sample size (n)
- 251
- 95% confidence interval
- 0.3118 to 0.5164
- Granger causality
- None
- Granger optimal lag
- 10
- Time coverage
- 2022-01-03 to 2022-12-30
AI analysis
Analysis: Cboe Tape C Trade Count vs. BTC/USDT Close Price (2022)
1. Relationship Overview
The scatterplot shows a positive but noisy association between Cboe U.S. equities Tape C trade counts and Bitcoin's closing price on Binance across 2022. Points form a loose upward-sloping cloud rather than a tight line — as trade count increases from roughly 16,000 to 47,000, BTC closing prices trend from the ~$1.4M–1.6M range toward $1.7M–2.4M (note: values appear to be in a scaled/indexed unit, not raw USD), but with substantial scatter at every X level. This is consistent with a moderate, not strong, linear relationship.
2. Strength, Direction, and Statistical Confidence
The correlation coefficient (r = 0.419) indicates a moderate positive linear relationship, but r² = 0.176 tells the more important story: only about 17.6% of the variance in BTC closing price is explained by equity trade count, leaving over 82% attributable to other factors. The 95% CI [0.312, 0.516] is reasonably tight and excludes zero, and the p-value (4.08e-12) confirms the correlation is highly statistically significant — this relationship is real, not a sampling artifact. However, statistical significance with n=251 daily observations should not be conflated with practical/predictive strength; a modest r² means this variable alone is a weak predictor of BTC price. Critically, the Granger causality tests show no significant predictive direction in either direction (X→Y: p=0.688; Y→X: p=0.099, only marginally suggestive at best). This means neither series reliably helps forecast future values of the other over a 10-period lag — the correlation is likely contemporaneous/co-incidental (both may respond to shared macro conditions) rather than one driving the other.
3. Patterns, Clusters, and Outliers
Two loose clusters are visible: a lower-left group (X: 16,000–24,000; Y: $1.4M–1.7M) and an upper-right group (X: 29,000–44,000; Y: $1.7M–2.4M), suggesting possible regime shifts over the year rather than a smooth continuous trend. Several notable outliers deviate from the main pattern — e.g., (29,103.94, 2,360,551) and (29,029.75, 2,539,164.95) show high BTC prices at relatively moderate trade counts, while (38,730.63, 2,411,035.26) and (36,445.31, 2,391,498.79) also sit above the regression line. These points likely correspond to specific volatile periods (e.g., early 2022 before the broader crypto selloff) where BTC price momentum was driven by crypto-specific events unrelated to equity market activity. The relationship also shows heteroscedasticity — scatter appears to widen at higher X values, indicating less predictive reliability in high-volume regimes.
4. Confounding Factors and Caveats
Both series are time-ordered financial/market data from 2022, a year marked by significant macro volatility (Fed rate hikes, inflation concerns, crypto contagion events like Terra/Luna and FTX). This raises strong concern for spurious correlation via shared trends: both equity trading activity and BTC price could be co-moving due to common macro drivers (risk sentiment, liquidity conditions, VIX-like volatility) rather than any direct causal link between Cboe trade counts and Binance BTC prices. Neither series was tested here for stationarity — if both exhibit trends or autocorrelation (likely, given they're daily financial time series), the Pearson r can be inflated by trend-following behavior alone, independent of any genuine relationship. The lack of Granger causality further supports the idea that this is a coincidental co-trend rather than a mechanistic link.
5. Suggestions for Further Investigation
To clarify whether this relationship is meaningful or spurious, analysts should: (a) difference or detrend both series (e.g., use daily returns/changes instead of levels) and recompute correlation and Granger tests, since level-based correlations in trending financial series are notoriously unreliable; (b) introduce a common macro control variable (e.g., VIX, DXY, or overall market volume) to test whether the BTC–equity trade count link disappears after controlling for shared risk sentiment; (c) segment the year into sub-periods (pre/post major crypto events) to see if the correlation is driven by a specific regime rather than holding consistently; and (d) given the weak r² and null Granger results, avoid using Tape C trade count as a standalone predictive feature for BTC price models — it may serve only as a weak, non-causal macro-co-movement indicator at best.
X dataset: CryptoDataDownload – Binance BTC/USDT Daily OHLCV
Y dataset: Cboe U.S. Equities Historical Market Volume Data 2022
Part of experiment: Bitcoin - CryptoDataDownload – Binance BTC/USDT Daily OHLCV vs Cboe U.S. Equities Historical Market Volume Data 2022