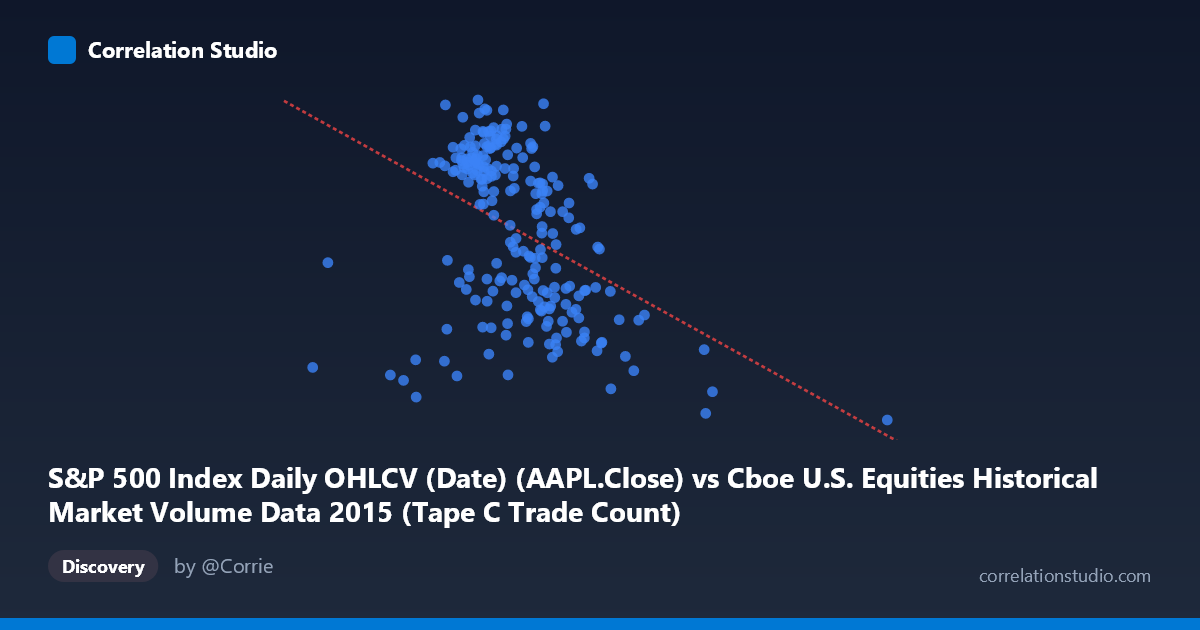
S&P 500 Index Daily OHLCV (Date) (AAPL.Close) vs Cboe U.S. Equities Historical Market Volume Data 2015 (Tape C Trade Count)
- Pearson correlation (r)
- -0.4101
- Spearman correlation
- -0.4491
- p-value
- 0
- Sample size (n)
- 222
- 95% confidence interval
- -0.514 to -0.2943
- Granger causality
- None
- Granger optimal lag
- 1
AI analysis
Scatterplot Analysis: AAPL Close Price vs. Cboe Tape C Trade Count (2015)
Relationship Overview The scatterplot reveals a modest negative relationship between Apple's closing stock price (X-axis) and the Cboe U.S. Equities Tape C trade count (Y-axis) across 2015. As AAPL's closing price increases, the number of Tape C trades tends to decrease, though with considerable scatter around the trend line. The linear regression equation (y = -2.25403E-05x + 137.992) captures this downward slope, and the relationship is most visible in the broader data cloud rather than any tight clustering. The bulk of observations concentrate in the AAPL price range of roughly $600,000–$950,000 (scaled units) and trade counts between approximately 108 and 133, suggesting a fairly defined operational band for most of the year.
Correlation Strength and Statistical Significance The Pearson correlation of r = -0.41 indicates a weak-to-moderate negative association. More tellingly, r² = 0.168, meaning AAPL's closing price explains only about 16.8% of the variance in Tape C trade counts — leaving over 83% attributable to other factors. While statistically highly significant (p = 2.058E-10, well below α = 0.05), this significance is largely a function of the substantial sample size (n = 222 paired observations; N = 506). The 95% confidence interval for r of [-0.514, -0.294] confirms the negative direction robustly, but the width of the interval signals meaningful uncertainty about the precise magnitude of the relationship. Critically, the Granger causality tests reveal no significant temporal predictive directionality in either direction — neither does AAPL price predict future Tape C trade counts (F = 0.63, p = 0.43), nor do trade counts predict future AAPL price (F = 0.008, p = 0.93). This means the correlation, while real in a cross-sectional sense, carries no useful forecasting power from one variable to the other on a day-lagged basis.
Notable Patterns, Clusters, and Outliers Several features stand out visually. The data cluster densely in the mid-price range (~650,000–850,000), with trade counts spanning a wide band — suggesting high day-to-day variability in trading activity even when AAPL price is relatively stable. There are at least two prominent outliers at the far right of the X-axis: one observation near x = 1,611,853 with a notably low trade count (~103), and another near x = 1,194,528 also with a depressed trade count (~104). These high-price, low-activity points exert leverage on the regression line and likely reinforce the negative slope disproportionately. At the lower price range, there are also a few observations with unusually low trade counts (~107–108), forming a lower-left cluster that deviates from the main data cloud. The overall spread suggests possible heteroscedasticity, with variance in Y appearing somewhat compressed at extreme X values.
Confounding Factors and Interpretive Caveats Several important caveats apply. First, the dataset labeling appears cross-joined — the X-axis references AAPL closing prices from one dataset while the Y-axis references trade count data from another, meaning this correlation may be an artifact of temporal coincidence across 2015 rather than any structural market mechanism. Both variables are time-indexed, so what appears to be a price-volume relationship may simply reflect shared macroeconomic or seasonal trends (e.g., market-wide volatility events in August 2015 that simultaneously depressed AAPL prices and altered trading volumes). The outliers at very high X values likely correspond to specific anomalous dates rather than representative conditions. Additionally, Tape C trade counts aggregate across many securities, not just AAPL, which further weakens any mechanistic interpretation of a direct link between these two specific series.
Actionable Insights and Further Investigation Given the weak explanatory power and absent Granger causality, this correlation should not be used as a predictive signal in any trading or operational model. However, the relationship merits further investigation in several directions: (1) Control for date by examining whether the correlation disappears after removing temporal trend (i.e., detrending both series), which would test whether this is purely a time-coincidence artifact; (2) Investigate the outlier dates corresponding to AAPL prices above $1,000,000 (scaled) to understand whether specific market events (e.g., the August 2015 flash crash) are driving the observed pattern; (3) Segment the analysis by market regime (low vs. high volatility periods) to determine whether the correlation strengthens or reverses under different conditions; and (4) Incorporate additional variables such as VIX, overall market volume, or AAPL-specific volume to build a more complete explanatory model for Tape C trade counts, which clearly require more than AAPL price alone to understand.
X dataset: Cboe U.S. Equities Historical Market Volume Data 2015
Y dataset: S&P 500 Index Daily OHLCV (Date)
Part of experiment: Daily - Cboe U.S. Equities Historical Market Volume Data 2015 vs S&P 500 Index Daily OHLCV (Date)