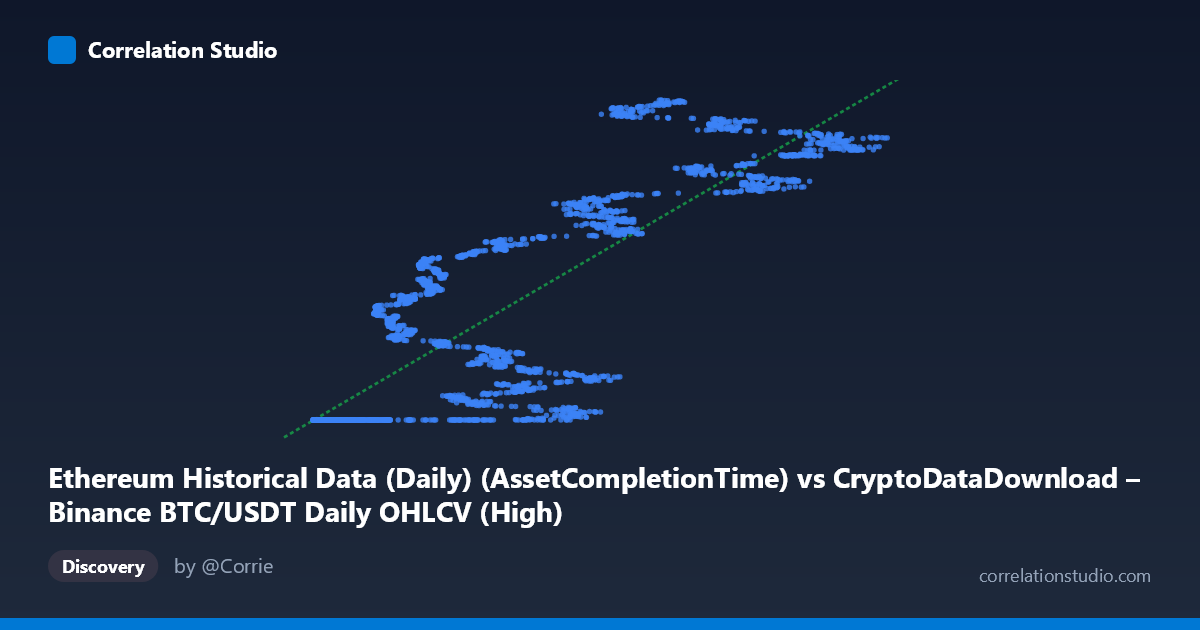
Ethereum Historical Data (Daily) (AssetCompletionTime) vs CryptoDataDownload – Binance BTC/USDT Daily OHLCV (High)
- Pearson correlation (r)
- 0.8505
- Spearman correlation
- 0.886
- p-value
- 0
- Sample size (n)
- 3191
- 95% confidence interval
- 0.8407 to 0.8599
- Granger causality
- None
- Granger optimal lag
- 10
AI analysis
Analysis of Ethereum/Bitcoin Cross-Metric Relationship
1. What the Visualization Reveals
The scatterplot shows a strong positive, though clearly non-linear, relationship between two variables that are themselves mislabeled proxies for time: the X-axis field is actually the completion timestamp column and Y is the BTC/USDT daily "High" price. In effect, this chart plots one time-indexed series against another, so the "correlation" is largely a reflection of how both variables trend together across the 2017–2026 window rather than a direct causal or mechanistic link between Ethereum activity and Bitcoin price. The data reveals a distinct clustering pattern: a dense horizontal band around Y ≈ 1,614,335,000–1,614,336,000 for X values below roughly 25,000, followed by a steep, almost vertical climb in Y as X increases beyond ~27,000. This is characteristic of a regime shift or a piecewise structure rather than a smooth linear trend.
2. Strength, Direction, and Statistical Meaning
The Pearson correlation (r = 0.8505, r² = 0.7234) indicates a strong positive association, with the linear model explaining about 72.3% of the variance in Y. The 95% CI [0.8407, 0.8599] is tight given the large sample (n = 3,191), and the p-value of 0 confirms the correlation is highly statistically significant — essentially no chance this pattern arose from random noise. However, statistical significance here should not be conflated with practical or causal significance: with time-ordered data, high r values are common and expected even between unrelated series, since both are autocorrelated and trending. The Granger causality results reinforce this caution — neither direction (X→Y: F=1.157, p=0.315; Y→X: F=1.512, p=0.129) is significant at the standard 0.05 threshold, meaning neither variable meaningfully predicts the other's future values beyond what its own past provides. This is a strong signal that the correlation is likely spurious or driven by a shared external trend (e.g., overall time/market growth) rather than genuine predictive or causal linkage.
3. Notable Patterns and Non-Linear Features
The most striking feature is the flat plateau at low X values (roughly X < 25,000) where Y stays pinned near 1,614,335,000–1,614,336,000 regardless of X — this looks like a data artifact, possibly a placeholder/default value, missing-data fill, or an early period where the Y metric was constant or not yet actively recorded. Beyond this threshold, Y rises steeply and with much more scatter, suggesting increased volatility or a genuine market regime beginning around that X value. This two-regime structure (flat/constant then rapidly increasing with variance) strongly violates the linearity assumption underlying the reported r² and regression equation (y = 1406.51x + 1.609×10⁹), meaning the single linear fit likely underserves both segments and a piecewise or log-linear model would fit the data far more faithfully.
4. Confounding Factors and Caveats
Several caveats are critical here. First, and most importantly, the X-axis is a timestamp/completion-time field, not a substantive Ethereum metric — this makes the entire "correlation" a time-trend artifact: BTC prices generally rose over 2017–2026, and if X increases with time, then Y will appear correlated with X regardless of any real relationship. Second, the flat plateau suggests possible data quality issues (repeated/default values) in a substantial subset of the sample, which could inflate apparent fit statistics. Third, both series are highly autocorrelated (typical of financial time series and cumulative counters), which violates the independence assumption behind standard significance testing, making the p-value from the correlation coefficient overly optimistic/unreliable compared to the more appropriately time-aware Granger test.
5. Suggestions for Further Investigation
Before drawing conclusions, the underlying data pipeline should be audited: confirm that "X" and "Y" are the intended substantive variables and not mistakenly mapped timestamp/price columns, and investigate the cause of the flat-line cluster below X≈25,000 (likely a data-loading or default-value bug). If the intent was to compare Ethereum network activity (e.g., gas used, transaction counts) against BTC price, that column should be re-extracted and re-plotted. Once corrected, analysts should de-trend both series (e.g., using differencing or percentage returns) and re-run correlation and Granger tests on the stationary series, since raw-level trending variables routinely produce misleading high r² values. Segmenting the analysis into the two apparent regimes (pre/post the ~25,000 threshold) and fitting non-linear or piecewise models would also yield a more accurate and interpretable relationship than the current single linear regression.
X dataset: CryptoDataDownload – Binance BTC/USDT Daily OHLCV
Y dataset: Ethereum Historical Data (Daily)
Part of experiment: Bitcoin - CryptoDataDownload – Binance BTC/USDT Daily OHLCV vs Ethereum Historical Data (Daily)