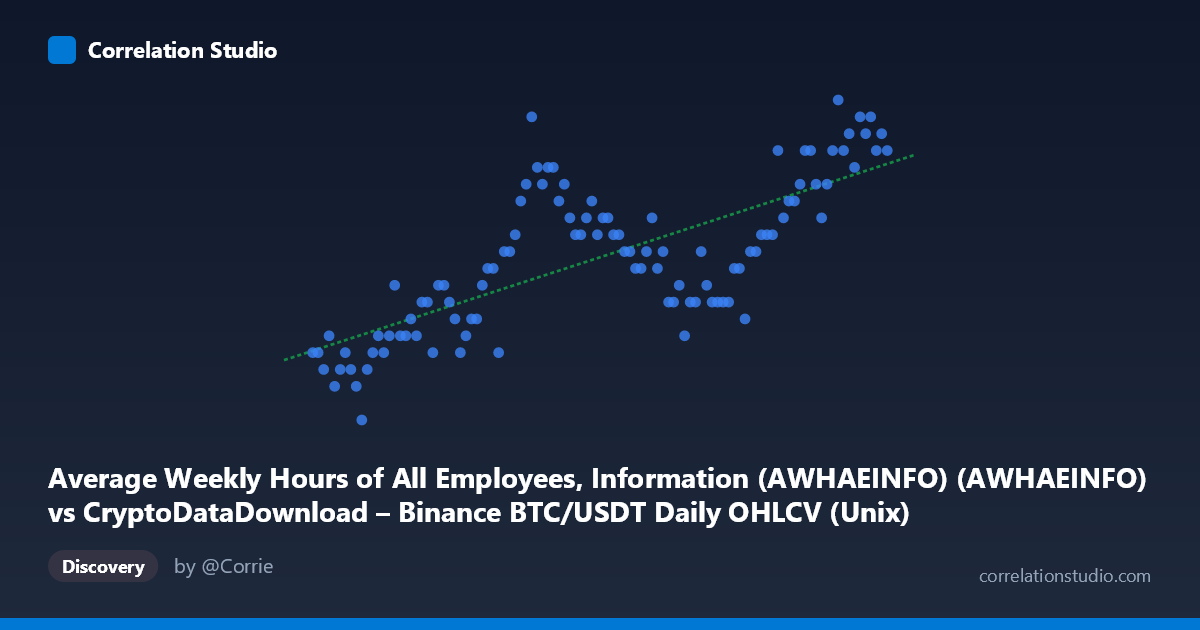
Average Weekly Hours of All Employees, Information (AWHAEINFO) (AWHAEINFO) vs CryptoDataDownload – Binance BTC/USDT Daily OHLCV (Unix)
- Pearson correlation (r)
- 0.7341
- Spearman correlation
- 0.7245
- p-value
- 0
- Sample size (n)
- 106
- 95% confidence interval
- 0.6318 to 0.8112
- Granger causality
- None
- Granger optimal lag
- 1
- Time coverage
- 2017-09-01 to 2026-06-01
- Recomputed on refreshed data
- 2026-10-08 (r was 0.7282)
AI analysis
Analysis: Average Weekly Hours (Information Sector) vs. Time-Indexed Value
1. Overview of the Relationship
This scatterplot shows a moderate-to-strong positive linear relationship (r = 0.728) between a time variable (X-axis, spanning late 2017 to early 2026) and average weekly hours in the Information sector (Y-axis, ranging 35.7–38.0 hours). Despite the axis labels referencing BTC/USDT OHLCV data, the actual X values are Unix timestamps rather than price data, meaning this plot effectively depicts a time-series trend — how average weekly hours have evolved over roughly an 8-year period. The upward slope indicates that, on average, weekly hours in this sector have increased over time.
2. Correlation Strength and Statistical Significance
The correlation coefficient of r = 0.728 yields r² = 0.530, meaning roughly 53% of the variance in average weekly hours is statistically associated with the passage of time — a substantial but not overwhelming share, leaving nearly half the variance unexplained by this simple linear trend. The 95% confidence interval [0.624, 0.807] is reasonably tight and entirely excludes zero, and the p-value (effectively 0) confirms this relationship is highly unlikely to be due to chance, especially given n = 105 paired observations. However, the Granger causality tests reveal an important nuance: neither direction shows significant predictive causality (X→Y: p = 0.166; Y→X: p = 0.166). This tells us that while X and Y are correlated contemporaneously, past values of one do not meaningfully improve forecasts of the other's future values — the relationship is associative, not predictive/causal in a temporal-lag sense.
3. Notable Patterns and Features
The data shows a clear regime shift rather than smooth linear growth: values cluster around 35.9–36.5 hours from 2017–2021, then step up to a 36.4–37.6 range from 2022 onward, with the most recent points (2025–2026) reaching 37.1–38.0. This suggests a structural break or plateau-then-rise pattern rather than constant-rate growth, which the linear R² of 0.530 only partially captures. There's also a visible dip around 2020 (36.1–36.2 during the pandemic period) before the sustained climb resumes — consistent with known labor market disruptions in that era. The near-zero regression slope coefficient (4.13E-12) reflects the enormous scale mismatch between raw Unix timestamps and hours, not a weak effect.
4. Confounding Factors and Caveats
Since X is essentially a time index, this "correlation" is really describing a secular trend, which is highly susceptible to confounding by any factor that changes systematically over time — sector-wide shifts to salaried/exempt roles, remote work adoption, pandemic-era labor restructuring, or BLS methodology/seasonal-adjustment revisions. The mismatched dataset descriptions (BTC OHLCV vs. macroeconomic labor data) suggest possible data pipeline or labeling errors that should be verified before drawing substantive conclusions. Additionally, monthly labor statistics have inherent autocorrelation, which can inflate apparent linear r² even when the underlying process is a slow drift rather than a true bivariate causal relationship.
5. Recommendations
Given the non-significant Granger causality, this should be treated as a trend-description exercise, not a predictive model — avoid using time-based linear extrapolation for forecasting future hours without incorporating seasonality, structural breaks, or leading economic indicators (e.g., job openings, sector employment growth). Analysts should first confirm correct data alignment (the axis labels appear swapped/mismatched) and consider a piecewise or spline regression to capture the apparent 2021–2022 regime shift. Further investigation should explore sector-specific drivers (tech layoffs, AI-driven restructuring, hybrid work policies) rather than relying on time as a proxy variable.
X dataset: CryptoDataDownload – Binance BTC/USDT Daily OHLCV
Y dataset: Average Weekly Hours of All Employees, Information (AWHAEINFO)
Part of experiment: Bitcoin - CryptoDataDownload – Binance BTC/USDT Daily OHLCV vs Average Weekly Hours of All Employees, Information (AWHAEINFO)