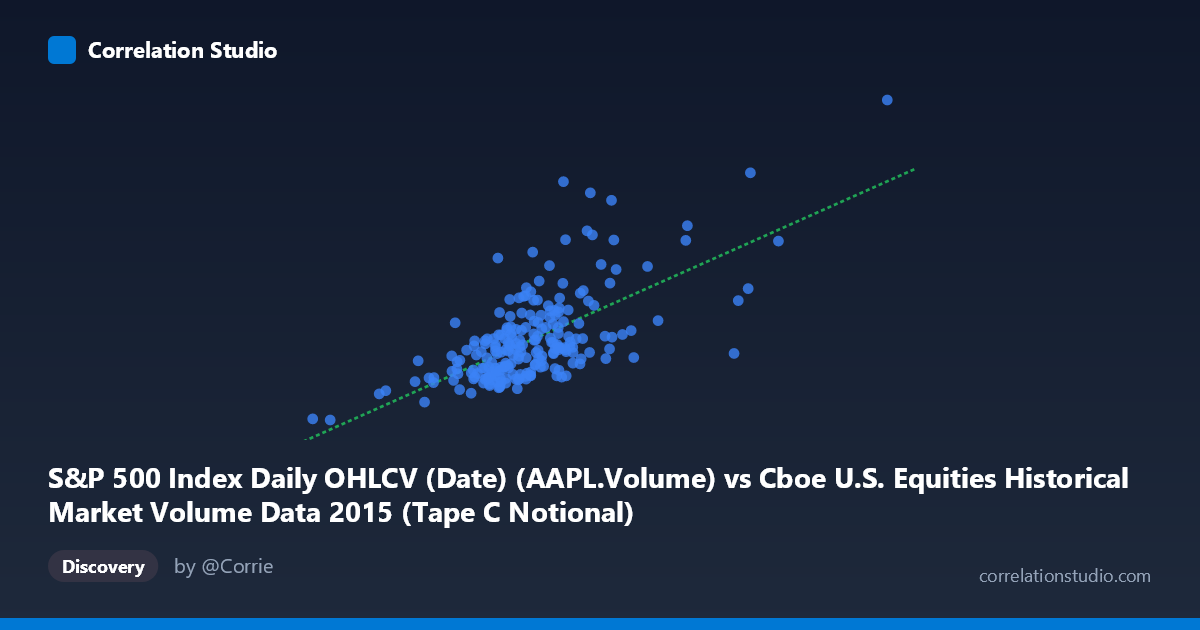
S&P 500 Index Daily OHLCV (Date) (AAPL.Volume) vs Cboe U.S. Equities Historical Market Volume Data 2015 (Tape C Notional)
- Pearson correlation (r)
- 0.6603
- Spearman correlation
- 0.6032
- p-value
- 0
- Sample size (n)
- 222
- 95% confidence interval
- 0.5789 to 0.7286
- Granger causality
- None
- Granger optimal lag
- 10
AI analysis
Scatterplot Analysis: AAPL Volume vs. Cboe Tape C Notional (2015)
Relationship Overview The scatterplot reveals a moderate positive relationship between Apple Inc.'s daily trading volume (AAPL.Volume, X-axis) and the Cboe U.S. Equities Tape C Notional value (Y-axis) across 222 trading days in 2015. As AAPL volume increases, Tape C Notional value tends to rise correspondingly, which is intuitive given that AAPL — as one of the largest and most actively traded equities — is itself a meaningful constituent of Tape C market activity. The linear regression equation (y = 0.01126x − 14,758,300) suggests that each additional share of AAPL traded is associated with roughly $0.011 in Tape C notional value, though this relationship is far from deterministic.
Correlation Strength and Statistical Framing The Pearson correlation of r = 0.6603 indicates a moderate-to-strong positive association, but the coefficient of determination (r² = 0.4360) is the more sobering figure: only 43.6% of the variance in Tape C Notional is explained by AAPL Volume, leaving the majority of variation attributable to other factors. The 95% confidence interval [0.5789, 0.7286] is relatively tight and does not include zero, and the p-value is effectively zero (p ≈ 0), confirming the correlation is highly statistically significant across the n = 222 paired observations. However, Granger causality tests reveal no significant temporal predictive direction in either direction — neither X→Y (F = 0.7318, p = 0.694) nor Y→X (F = 0.5932, p = 0.818) — meaning that past AAPL volume does not reliably forecast future Tape C Notional, and vice versa, at the optimal 10-period lag. This critically distinguishes contemporaneous correlation from predictive causation.
Notable Patterns, Clusters, and Outliers The bulk of the data clusters in a relatively compact region — AAPL volumes roughly between 4.0–6.5 billion and Tape C Notional values between 25–75 million — with the relationship appearing broadly linear within this core. However, two prominent outliers stand out dramatically: the point near (12.35B, 162.2M) and another near (6.38B, 124.1M), both of which sit well above the regression line and likely correspond to high-volatility events such as earnings announcements, market corrections, or macro shocks in 2015 (e.g., the August flash crash). A third cluster of elevated Tape C values (≥100M) near the 6.8–8.7B AAPL volume range also suggests non-linearity at the upper tail, where extreme AAPL activity may amplify broader market notional disproportionately. The lower-left region contains a sparse but notable low-volume, low-notional cluster, including the point near (2.07B, 13.0M), representing unusually quiet trading sessions.
Confounding Factors and Caveats Several important caveats temper this analysis. First, AAPL volume and Tape C Notional are not independent — AAPL trades are themselves part of Tape C, creating a degree of self-referential correlation that inflates the observed r. Second, both variables are strongly influenced by shared latent drivers — market-wide volatility (VIX spikes), macroeconomic announcements, Federal Reserve communications, and seasonal liquidity patterns — meaning the correlation may largely reflect these common shocks rather than a direct structural link. Third, the time coverage is a single calendar year (2015), limiting generalizability; 2015 was notable for elevated volatility, particularly in August, which may have produced the extreme outliers that are disproportionately driving the correlation. Finally, the mismatch in dataset labeling (X-axis column from one dataset appearing on the Y-axis description and vice versa) warrants verification to ensure the axes are correctly assigned.
Actionable Insights and Further Investigation Practitioners should be cautious about using AAPL volume alone as a proxy or predictor for broad market notional activity, given that causality is absent and 56% of variance remains unexplained. Recommended next steps include: (1) re-running the correlation after removing AAPL's own contribution to Tape C Notional to obtain a cleaner independence test; (2) incorporating volatility controls (e.g., VIX or realized variance) to partial out shared market-wide drivers; (3) examining whether the outlier events cluster around identifiable dates (AAPL earnings: April 27, July 21, October 27, 2015) to assess whether event-driven spikes are distorting the aggregate relationship; and (4) extending the analysis across multiple years to test whether the r = 0.66 relationship is stable or an artifact of 2015's specific market conditions. A non-linear or quantile regression approach may also better capture the tail behavior visible in the upper-right region of the plot.
X dataset: Cboe U.S. Equities Historical Market Volume Data 2015
Y dataset: S&P 500 Index Daily OHLCV (Date)
Part of experiment: Daily - Cboe U.S. Equities Historical Market Volume Data 2015 vs S&P 500 Index Daily OHLCV (Date)