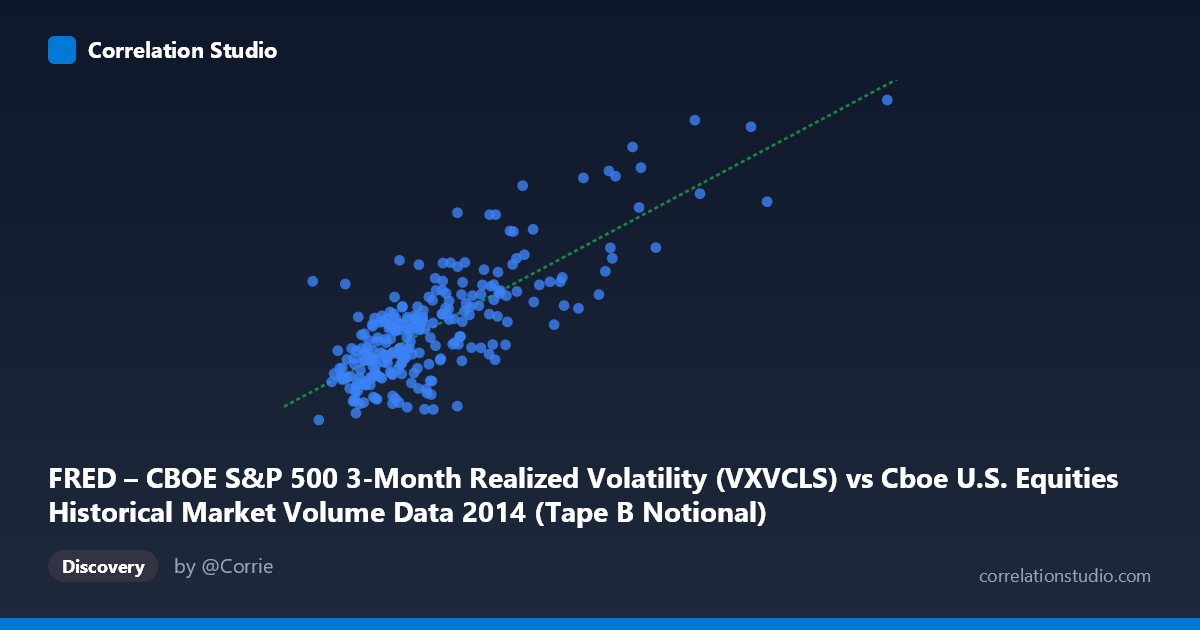
FRED – CBOE S&P 500 3-Month Realized Volatility (VXVCLS) vs Cboe U.S. Equities Historical Market Volume Data 2014 (Tape B Notional)
- Pearson correlation (r)
- 0.7867
- Spearman correlation
- 0.6922
- p-value
- 0
- Sample size (n)
- 252
- 95% confidence interval
- 0.7345 to 0.8296
- Granger causality
- None
- Granger optimal lag
- 1
AI analysis
Scatterplot Analysis: CBOE S&P 500 3-Month Realized Volatility vs. Tape B Notional Volume (2014)
Relationship Overview
The scatterplot reveals a moderately strong positive relationship between CBOE S&P 500 3-month realized volatility (VXVCLS) and Tape B notional trading volume in U.S. equity markets throughout 2014. As volatility rises, notional volume traded on Tape B exchanges increases commensurately. This is economically intuitive: elevated volatility environments tend to drive heightened trading activity as market participants reposition, hedge, or react to price swings. The linear regression equation (y = 1.02×10⁻⁹x + 11.12) suggests that for every ~1 billion unit increase in notional volume, realized volatility rises by approximately 1.02 index points, anchored to a baseline of ~11.12.
Correlation Strength and Statistical Significance
The correlation is meaningfully strong (r = 0.787), and the R² of 0.619 indicates that roughly 62% of the variance in 3-month realized volatility is explained by Tape B notional volume — a substantial explanatory share, though ~38% remains attributed to other factors. The 95% confidence interval [0.735, 0.830] is relatively narrow given the sample of 252 paired observations drawn from a population of 3,686, lending high precision to the estimate. The p-value of effectively zero confirms this relationship is extremely unlikely to be a statistical artifact. However, the Granger causality tests tell a notably different story: neither direction (X→Y: F=1.71, p=0.19; Y→X: F=0.007, p=0.94) achieves significance at conventional thresholds, meaning that despite their strong contemporaneous correlation, neither variable reliably predicts the other one period ahead. This distinguishes a concurrent co-movement from a true temporal, predictive relationship.
Notable Patterns, Clusters, and Outliers
The data exhibits a clear lower-left cluster where the bulk of observations congregate — roughly between 2.1–5.5 billion in notional volume and 12–18 on the volatility index — reflecting typical "calm market" trading conditions that dominated much of 2014. However, a distinct upper-right cluster of outliers is visible, with several points reaching notional volumes of 7.7–13.0 billion and volatility readings of 17–23+. These high-leverage points (visible in the sample data, e.g., 10.4B/22.85, 9.4B/23.09) likely correspond to specific volatility episodes in late 2014, such as the October market correction driven by Ebola fears and global growth concerns. One anomalous point stands out at approximately (2.12B, 17.26) — unusually high volatility for very low notional volume — which may represent a holiday-shortened or low-liquidity trading session worth flagging.
Confounding Factors and Caveats
Several important caveats temper interpretation. Causality is ambiguous: the Granger results confirm that the contemporaneous correlation does not imply one variable drives the other in a lagged temporal sense; both likely respond jointly to common macro or event-driven shocks. Tape B is a subset of total U.S. equity volume (covering NYSE MKT/Amex-listed securities), so it may not fully represent broader market activity, and its notional value is sensitive to the price levels of constituent securities — large-cap moves can distort notional figures independently of actual trade count or volatility. Additionally, 2014 is a single calendar year, limiting generalizability; the correlation structure could behave differently in bear markets or structural volatility regime shifts. The 3-month horizon of VXVCLS also introduces temporal averaging that may smooth intraday or single-session volatility spikes, potentially understating the true relationship at finer time scales.
Actionable Insights and Further Investigation
Practitioners could use the strong contemporaneous correlation as a regime indicator: sustained Tape B notional volume above ~6 billion may serve as an early-warning signal of elevated volatility regimes, informing options hedging or risk management triggers. However, given the absence of Granger causality, trading strategies relying on one variable to predict the next day's value of the other should be approached with skepticism. Further investigation should explore: (1) whether the relationship holds across multiple years and volatility regimes (2008, 2020); (2) whether total notional volume (not just Tape B) strengthens or weakens the correlation; (3) the specific dates of the upper-right outlier cluster to test whether event-driven episodes disproportionately drive the R²; and (4) multivariate models incorporating VIX term structure, market breadth, or order flow imbalance to capture the unexplained 38% variance.
X dataset: Cboe U.S. Equities Historical Market Volume Data 2014
Y dataset: FRED – CBOE S&P 500 3-Month Realized Volatility
Part of experiment: Daily - Cboe U.S. Equities Historical Market Volume Data 2014 vs FRED – CBOE S&P 500 3-Month Realized Volatility