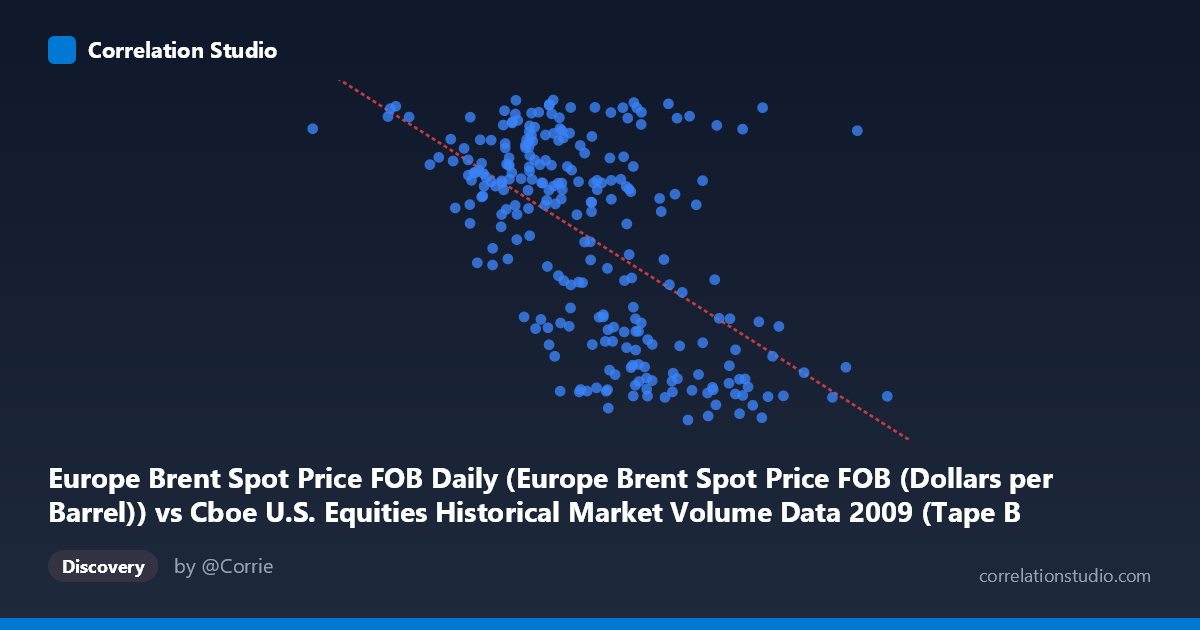
Europe Brent Spot Price FOB Daily (Europe Brent Spot Price FOB (Dollars per Barrel)) vs Cboe U.S. Equities Historical Market Volume Data 2009 (Tape B Notional)
- Pearson correlation (r)
- -0.5775
- Spearman correlation
- -0.5392
- p-value
- 0
- Sample size (n)
- 252
- 95% confidence interval
- -0.6544 to -0.4888
- Granger causality
- None
- Granger optimal lag
- 1
AI analysis
Scatterplot Analysis: Europe Brent Spot Price vs. Cboe Tape B Notional Value (2009)
Relationship Overview
The scatterplot reveals a moderate negative relationship between Europe Brent Spot Price (X-axis, in dollars per barrel) and Cboe Tape B Notional trading volume (Y-axis, in billions). As oil prices increase, Tape B notional trading activity tends to decrease, and vice versa. The linear regression equation (y = -5.44×10⁻⁹x + 90.45) confirms this inverse slope, though the wide scatter around the regression line makes immediately clear that this is far from a deterministic relationship. The data spans the full calendar year 2009 — a period of dramatic oil price recovery from post-financial-crisis lows — which provides meaningful dynamic range for both variables but also introduces substantial time-varying confounds.
Correlation Strength and Statistical Significance
The Pearson correlation of r = -0.5775 indicates a moderate negative association, but the explanatory power is more modest than the correlation coefficient alone might suggest: R² = 0.3335, meaning only about 33% of the variance in Tape B notional volume is explained by oil price levels. Roughly two-thirds of the variation remains unaccounted for. The 95% confidence interval of [-0.6544, -0.4888] is relatively tight and does not cross zero, and the p-value is effectively zero (p ≈ 0), confirming the correlation is highly statistically significant given the sample size (n = 252 paired observations from a population of N = 3,232). However, statistical significance should not be conflated with practical or causal significance. Critically, the Granger causality tests reveal no significant directional predictive relationship in either direction: neither does oil price help forecast Tape B volume (F = 0.307, p = 0.580), nor does Tape B volume help forecast oil price (F = 2.856, p = 0.092, approaching but not meeting conventional significance thresholds). This means that while the two series are contemporaneously correlated, neither variable meaningfully predicts the other's future values at a one-day lag.
Patterns, Clusters, and Notable Features
The sample points reveal a distinctive dual-cluster or fan-shaped structure rather than a clean linear relationship. High Tape B notional values (roughly 65–78 billion) appear across a wide range of oil prices (approximately \$40–\$80/barrel), while low notional values (roughly 40–55 billion) tend to concentrate at both low and high oil price extremes, with some clustering in the \$60–\$80 price range. Several points stand out as potential outliers — for example, the observation near (1.32B, 75.15) represents an unusually low oil price reading with high notional volume, and points near (\$87–\$95/barrel) show very low notional activity. The vertical spread at any given oil price level is substantial (often spanning 20–30 billion in notional), strongly suggesting the relationship is heteroscedastic and that additional variables are driving much of the within-price-level variation.
Confounding Factors and Caveats
Several important caveats apply to this analysis. First, 2009 was a structurally unusual year: oil prices rose from roughly \$35/barrel in January to nearly \$80/barrel by year-end, coinciding with a broad equity market recovery from the financial crisis. Both variables were simultaneously driven by macroeconomic recovery dynamics, making it difficult to disentangle a genuine oil-volume relationship from shared exposure to the economic cycle. Second, Tape B specifically captures NYSE MKT (AMEX) and regional exchange volume, which may have unique sector exposures (e.g., energy, small-cap) that create an asymmetric linkage to oil prices compared to broader market measures. Third, the absence of Granger causality is a meaningful warning against any narrative that oil prices "cause" trading volume changes or vice versa — any observed correlation is likely spurious or mediated by common macro drivers such as risk appetite, volatility regimes (VIX), or Federal Reserve policy. Finally, daily data introduces autocorrelation in both series, which can inflate apparent correlation significance even with robust sample sizes.
Actionable Insights and Further Investigation
Despite the lack of causal directionality, the moderate negative correlation and the clustering patterns suggest several productive avenues. Regime-based analysis — separating the data into oil price quartiles or into pre/post-March 2009 (market bottom) periods — could reveal whether the relationship holds consistently or is driven by a specific sub-period. Incorporating VIX or broader market volume as a control variable would help test whether the oil-Tape B correlation survives after accounting for the common risk-sentiment factor. A rolling correlation analysis across the year would illuminate whether the relationship was stable or shifted as oil prices and market conditions evolved. Finally, examining other Tape segments (Tape A for NYSE, Tape C for Nasdaq) would clarify whether this inverse relationship is specific to Tape B's sector composition or reflects a broader market-wide phenomenon. Given the Granger non-causality finding, any trading strategy predicated on oil prices predicting volume (or vice versa) should be approached with significant skepticism.
X dataset: Cboe U.S. Equities Historical Market Volume Data 2009
Y dataset: Europe Brent Spot Price FOB Daily
Part of experiment: Daily - Cboe U.S. Equities Historical Market Volume Data 2009 vs Europe Brent Spot Price FOB Daily