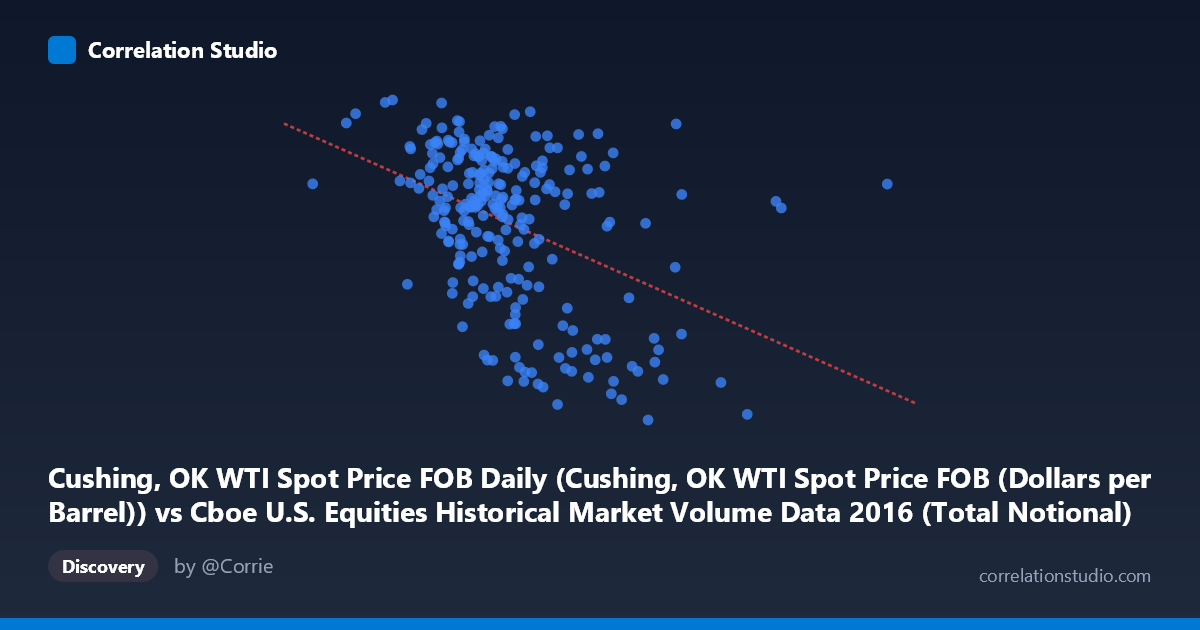
Cushing, OK WTI Spot Price FOB Daily (Cushing, OK WTI Spot Price FOB (Dollars per Barrel)) vs Cboe U.S. Equities Historical Market Volume Data 2016 (Total Notional)
- Pearson correlation (r)
- -0.4188
- Spearman correlation
- -0.3922
- p-value
- 0
- Sample size (n)
- 252
- 95% confidence interval
- -0.5157 to -0.3114
- Granger causality
- None
- Granger optimal lag
- 1
AI analysis
Analysis: WTI Crude Oil Price vs. U.S. Equities Market Volume (2016)
Relationship Overview The scatterplot reveals a moderate negative relationship between Cboe U.S. equities total notional trading volume (X-axis) and WTI crude oil spot prices (Y-axis) across 252 trading days in 2016. As equity market trading volume increases, oil prices tend to be lower, and conversely, lower-volume trading days are associated with higher oil prices. The linear regression equation (y = -6.63E-10x + 55.90) confirms this inverse slope, though the scatter around the regression line is substantial, indicating considerable unexplained variation in the relationship.
Correlation Strength and Statistical Significance The Pearson correlation of r = -0.4188 indicates a moderate negative association, but the variance explained metric tells a more sobering story: r² = 0.1754 means only ~17.5% of the variance in oil prices is accounted for by equity trading volume, leaving roughly 82.5% attributable to other factors. The 95% confidence interval for r spans [-0.5157, -0.3114], a relatively tight range that does not cross zero, and the p-value of 3.997×10⁻¹² confirms this correlation is highly statistically significant — almost certainly not a chance finding given n = 252. However, statistical significance here is distinct from practical or causal significance. Critically, the Granger causality tests fail in both directions (X→Y: F = 0.553, p = 0.458; Y→X: F = 0.464, p = 0.497), meaning neither variable temporally predicts the other at a one-period lag. This is an important caveat: the variables move together in a cross-sectional sense across 2016, but neither demonstrably leads the other in a predictive, time-series framework.
Notable Patterns, Clusters, and Outliers Several structural features are visible in the data. A dense cluster of observations sits in the moderate-volume range (~15–20 billion notional) with oil prices between approximately 40–52 dollars per barrel, suggesting this represents the "baseline" trading environment for most of 2016. There is a visible upper-left zone of high oil prices paired with low volumes, consistent with calmer, lower-liquidity trading days. More strikingly, there are several outliers in the lower-right quadrant — notably points around (25B, 29–30) and (20–21B, 30–32) — representing high-volume days coinciding with very low oil prices. These likely correspond to specific market stress events in early 2016 when oil crashed toward multi-year lows and equity volatility spiked, driving volume. The relationship also appears non-linear, with the strongest negative association occurring at the extremes while the central mass of data is diffuse, suggesting a possible heteroscedastic or threshold-driven dynamic.
Confounding Factors and Caveats Several important caveats limit causal interpretation. First, 2016 was a structurally unusual year for both oil markets (prices rebounded from ~$26 in January to ~$54 by December following the OPEC production agreement) and equity markets (Brexit, U.S. election volatility). These concurrent macro-shocks could be driving both variables simultaneously through a common third factor — such as broad risk sentiment or macroeconomic uncertainty — rather than any direct relationship between them. Second, equity volume and oil prices operate on fundamentally different economic mechanisms; the observed correlation may largely reflect that high-stress macro periods (risk-off) simultaneously spike equity trading volume while suppressing commodity prices. Third, the dataset spans only one calendar year (N = 3,622 population, n = 252 sampled), which limits generalizability. Seasonal patterns in both oil demand and equity trading activity could introduce spurious correlation.
Actionable Insights and Further Investigation Given the failure of Granger causality in both directions, practitioners should avoid using equity volume as a short-term predictor of oil prices (or vice versa) in trading or forecasting models. However, the persistent cross-sectional correlation does suggest that monitoring aggregate equity market activity may serve as a useful ancillary risk indicator — unusually high volume days correlate with lower and more stressed oil price environments. Further investigation should include: (1) introducing a risk sentiment proxy (e.g., VIX) as a potential common driver and re-running partial correlation analysis; (2) extending the time window beyond 2016 to test whether this relationship is regime-dependent; (3) testing non-linear models (e.g., quantile regression or threshold regression) given the apparent heteroscedasticity; and (4) examining whether specific subsectors of equity volume (e.g., energy sector ETF volume) show stronger or directional relationships with WTI prices compared to aggregate market volume.
X dataset: Cboe U.S. Equities Historical Market Volume Data 2016
Y dataset: Cushing, OK WTI Spot Price FOB Daily
Part of experiment: Daily - Cboe U.S. Equities Historical Market Volume Data 2016 vs Cushing, OK WTI Spot Price FOB Daily