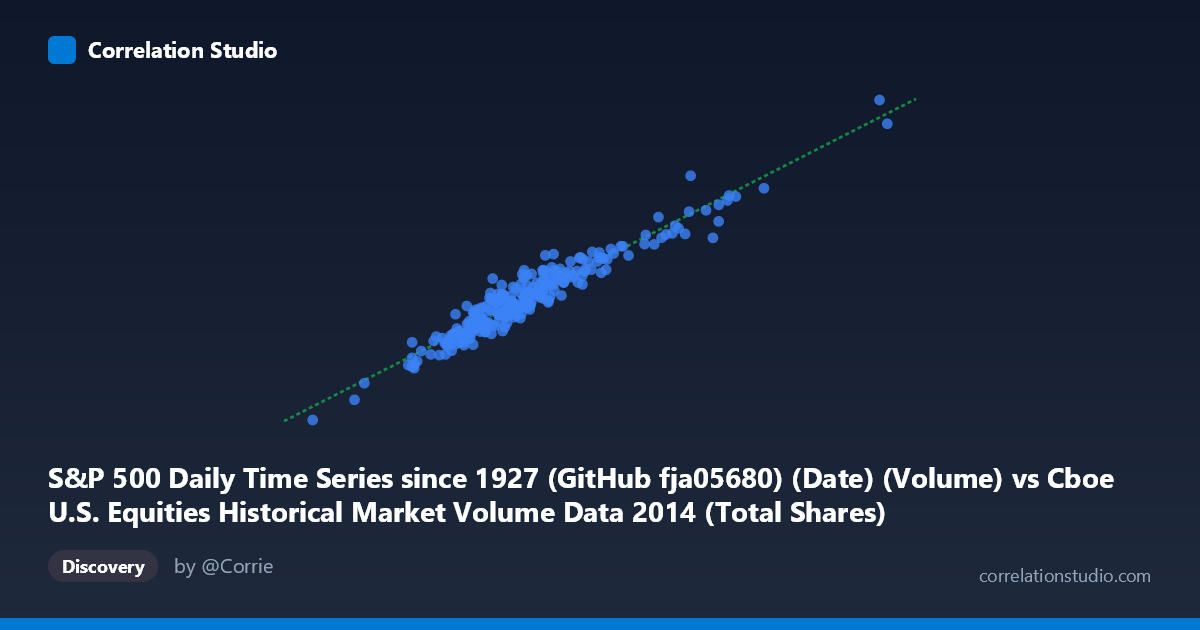
S&P 500 Daily Time Series since 1927 (GitHub fja05680) (Date) (Volume) vs Cboe U.S. Equities Historical Market Volume Data 2014 (Total Shares)
- Pearson correlation (r)
- 0.961
- Spearman correlation
- 0.9367
- p-value
- 0
- Sample size (n)
- 252
- 95% confidence interval
- 0.9503 to 0.9695
- Granger causality
- None
- Granger optimal lag
- 10
- Time coverage
- 2014-01-02 to 2014-12-31
AI analysis
Analysis: S&P 500 Daily Volume vs. Cboe U.S. Equities Total Shares (2014)
Relationship Overview The scatterplot reveals a strong, positive linear relationship between S&P 500 daily trading volume and Cboe U.S. Equities total shares traded across 252 trading days in 2014. As S&P 500 volume increases along the x-axis (ranging from roughly 194M to 851M), Cboe total shares traded rises correspondingly along the y-axis (from approximately 1.4B to 6.5B). The linear regression equation — y = 7.027x + 268,997,000 — suggests that for every additional share traded in the S&P 500 volume measure, total Cboe equities shares increase by roughly 7 shares, reflecting the broader market capture of the Cboe metric relative to the index-specific measure.
Correlation Strength and Statistical Significance The correlation is exceptionally strong at r = 0.9610, with an R² of 0.9235, meaning approximately 92.4% of the variance in Cboe total shares is statistically explained by S&P 500 volume. The 95% confidence interval of [0.9503, 0.9695] is narrow and sits entirely at the high end of the correlation scale, indicating the estimate is precise and robust. The p-value of effectively zero confirms this relationship is not a chance artifact in a sample of 252 paired observations. However, despite this powerful contemporaneous correlation, the Granger causality tests reveal no significant temporal predictive direction in either direction (X→Y: F=1.12, p=0.345; Y→X: F=1.04, p=0.413). Even with an optimal lag of 10 periods tested, neither series meaningfully predicts the other's future values, indicating the relationship is synchronous co-movement rather than one series leading the other.
Patterns, Clusters, and Outliers The bulk of observations cluster tightly in the lower-to-mid range (X: 300M–550M; Y: 2.2B–4.2B), consistent with typical 2014 trading days and reflecting the narrow standard deviation relative to the mean for both variables. The regression line fits this central cluster well. However, the scatter widens noticeably toward the upper right, with a handful of high-volume days (X 600M, Y 4.5B) showing greater dispersion — suggesting that on unusually active days, the relationship becomes somewhat less predictable. There are a few apparent outliers, most visibly one point near the lower left extreme (approximately 194M, 1.4B) and several points in the upper-right quadrant exceeding 700M and 5B respectively. These likely correspond to identifiable market events — end-of-quarter rebalancing, volatility spikes, or macro announcements — where volume surged across the entire U.S. equities market simultaneously.
Confounding Factors and Caveats The near-perfect correlation should be interpreted cautiously because these two variables are structurally linked by construction: S&P 500 volume is a major component of total U.S. equities market volume, so a large portion of the correlation is essentially tautological — measuring the same underlying trading activity through two overlapping lenses. This is not an independent causal relationship but rather a part-to-whole relationship, which will inherently produce high correlations. Additionally, both series share common external drivers — macroeconomic news, Federal Reserve announcements, earnings seasons, and broad risk-on/risk-off sentiment — that would inflate the apparent correlation regardless of any direct link. The absence of Granger causality reinforces this interpretation: both series respond simultaneously to the same market-wide stimuli rather than one influencing the other.
Actionable Insights and Further Investigation Given the structural overlap, a more analytically meaningful exercise would be to isolate the non-S&P-500 component of Cboe total volume (i.e., subtract the S&P 500 contribution) and examine whether that residual correlates with external variables such as VIX levels, options activity, or small-cap indices. Researchers should also investigate whether the high-volume outlier days cluster around specific calendar events (e.g., options expiration Fridays, FOMC decision days, or index rebalancing dates), as this could reveal how market stress amplifies the volume relationship non-linearly. Finally, extending this analysis to multiple years would test whether the regression slope (~7x multiplier) is stable over time or shifts as market structure evolves — a drift in this ratio could signal structural changes in how S&P 500 stocks' share of total U.S. equity volume changes, with implications for liquidity analysis and market microstructure research.
X dataset: Cboe U.S. Equities Historical Market Volume Data 2014
Y dataset: S&P 500 Daily Time Series since 1927 (GitHub fja05680) (Date)
Part of experiment: Daily - Cboe U.S. Equities Historical Market Volume Data 2014 vs S&P 500 Daily Time Series since 1927 (GitHub fja05680) (Date)