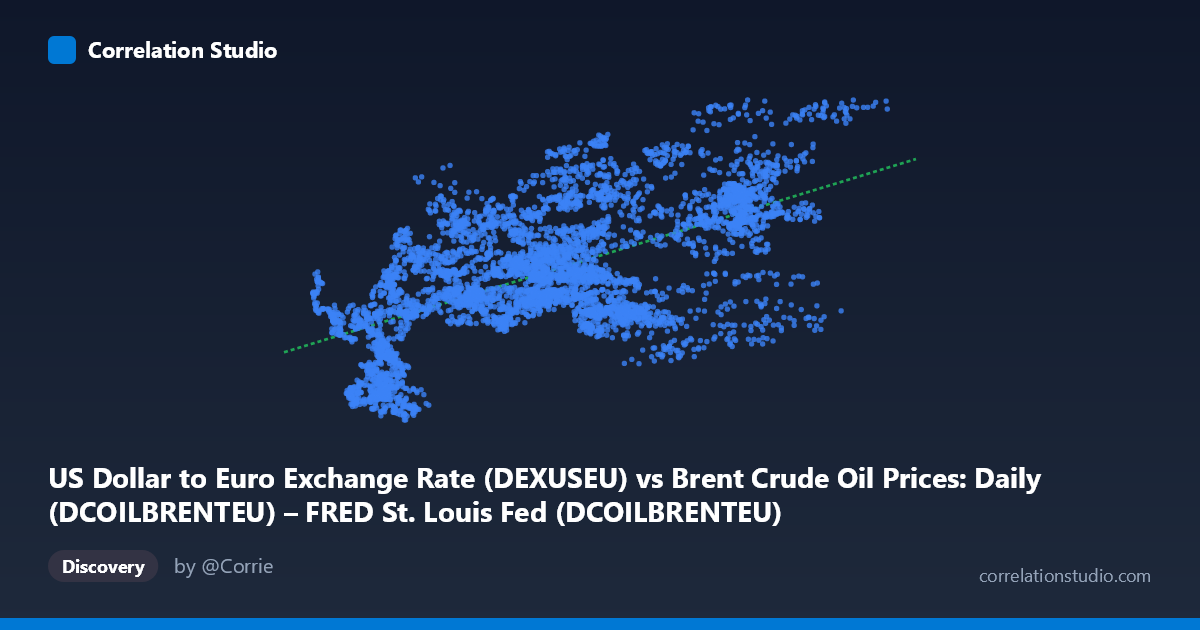
US Dollar to Euro Exchange Rate (DEXUSEU) vs Brent Crude Oil Prices: Daily (DCOILBRENTEU) – FRED St. Louis Fed (DCOILBRENTEU)
- Pearson correlation (r)
- 0.6077
- Spearman correlation
- 0.5537
- p-value
- 0
- Sample size (n)
- 6772
- 95% confidence interval
- 0.5925 to 0.6225
- Granger causality
- None
- Granger optimal lag
- 1
AI analysis
Analysis: Brent Crude Oil Prices vs. USD/Euro Exchange Rate
Relationship Overview
The scatterplot reveals a moderate positive relationship between Brent crude oil prices (X-axis, in USD/barrel) and the USD/Euro exchange rate (Y-axis). As crude oil prices rise, the Euro tends to appreciate against the dollar (a higher USD/Euro rate means more dollars per euro, i.e., a weaker dollar). This aligns with well-established macroeconomic theory: oil is priced in USD, so rising oil prices tend to weaken the dollar relative to other currencies, including the Euro. The linear regression equation (y = 0.00313x + 0.979) confirms the positive slope, though the relatively small coefficient indicates that large swings in oil prices translate to modest exchange rate movements.
Correlation Strength and Statistical Significance
With r = 0.608 and r² = 0.369, approximately 37% of the variance in the USD/Euro exchange rate is explained by Brent crude prices — a meaningful but far from complete relationship. Roughly 63% of the variance remains unexplained, pointing to substantial influence from other forces. The 95% confidence interval [0.593, 0.623] is notably narrow given the large paired sample (n = 6,772), and the p-value of effectively zero confirms this correlation is highly statistically significant — not a chance artifact. However, the Granger causality tests tell a more cautious story: neither direction (X→Y: F = 0.382, p = 0.537; Y→X: F = 0.276, p = 0.599) reaches significance at the optimal 1-period lag. This means that while the two variables are correlated contemporaneously, neither reliably predicts the other's next-day movement, which is critical context for any trading or forecasting application.
Patterns, Clusters, and Outliers
The sample points reveal considerable vertical scatter throughout the X range, particularly in the mid-range of oil prices (roughly $40–$100/barrel), where the exchange rate spans nearly the full Y range [0.83–1.59]. Several notable features emerge: - Low oil price zone (X < $30): Exchange rates cluster tightly around 0.89–1.13, with some potential outliers on the low end (e.g., points near y = 0.83–0.90 at x ≈ 20–30) - High oil price zone (X $100): Exchange rates trend higher (1.02–1.39), consistent with the positive relationship, but scatter remains wide - Mid-range ambiguity: Points like (81.44, 1.08) and (82.55, 0.96) sitting near (76.88, 1.35) illustrate that similar oil prices can correspond to dramatically different exchange rates, underscoring the non-deterministic nature of this relationship - The data spans 1999–2026, meaning different macroeconomic regimes (pre/post-GFC, COVID shock, energy crisis periods) are likely creating distinct sub-clusters that a single linear fit cannot fully capture
Confounding Factors and Caveats
Several important caveats apply. First, reverse causality and simultaneity are plausible — a weak dollar independently drives commodity prices higher since oil is dollar-denominated, creating a reflexive loop that complicates causal attribution. Second, monetary policy divergence between the Federal Reserve and ECB independently drives EUR/USD and may correlate with oil price cycles, acting as a major confound. Third, geopolitical shocks (Gulf Wars, Russia-Ukraine conflict, OPEC supply cuts) affect both variables simultaneously, inflating observed correlation without implying a structural relationship. Fourth, the Granger causality failure at a 1-day lag suggests that any predictive relationship, if it exists, may operate at longer time horizons (weekly, monthly) not captured here. Finally, the 27-year time span (1999–2026) encompasses multiple structural breaks, and pooling these regimes into a single linear model likely obscures regime-specific dynamics.
Actionable Insights and Further Investigation
Practitioners should avoid treating this correlation as a reliable short-term trading signal — the Granger causality results specifically warn against using yesterday's oil price to forecast today's exchange rate (or vice versa). For deeper insight, several investigative steps are warranted: (1) Segment the data by macroeconomic regime (pre-GFC, 2008–2015, post-COVID) to test whether the correlation is stable or regime-dependent; (2) Test Granger causality at longer lags (5, 10, 22 trading days) where fundamental repricing mechanisms may operate; (3) Introduce control variables — Fed/ECB interest rate differentials, US trade balance, and global risk sentiment (VIX) — in a multivariate model to isolate the oil-FX channel; (4) Explore non-linear specifications (e.g., threshold regression or regime-switching models) given the visual scatter heterogeneity; and (5) Examine whether the relationship strengthens during oil price extremes, as the marginal dollar-weakening effect may be non-linear near supply shock thresholds.
X dataset: Brent Crude Oil Prices: Daily (DCOILBRENTEU) – FRED St. Louis Fed
Y dataset: US Dollar to Euro Exchange Rate
Part of experiment: Daily - Brent Crude Oil Prices: Daily (DCOILBRENTEU) – FRED St. Louis Fed vs US Dollar to Euro Exchange Rate