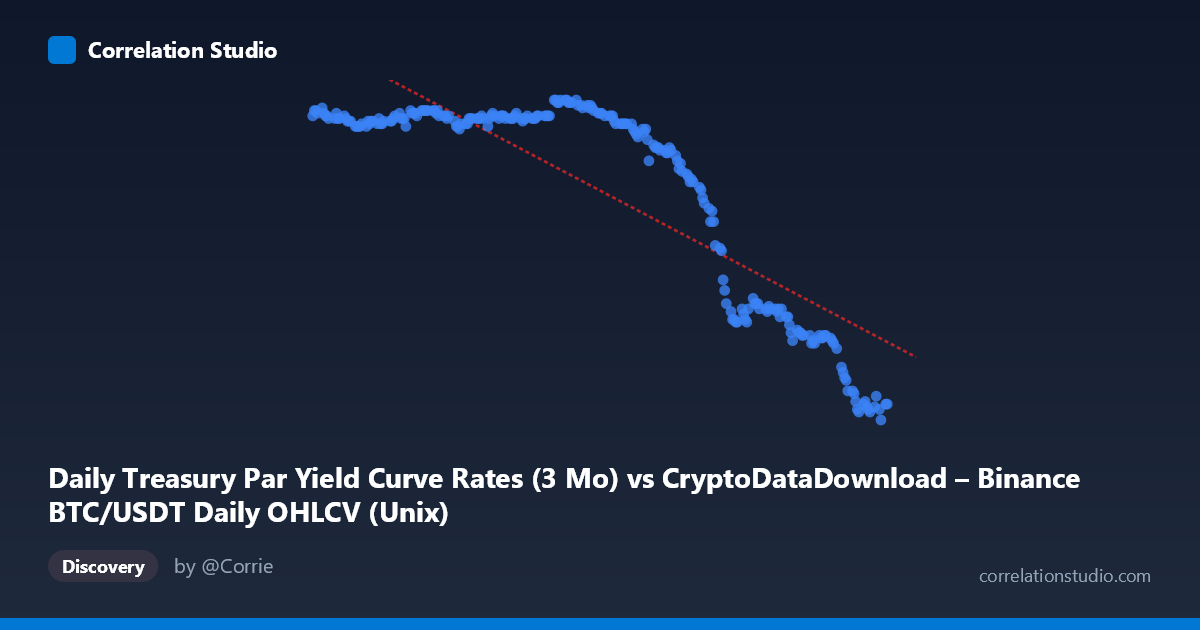
Daily Treasury Par Yield Curve Rates (3 Mo) vs CryptoDataDownload – Binance BTC/USDT Daily OHLCV (Unix)
- Pearson correlation (r)
- -0.855
- Spearman correlation
- -0.7697
- p-value
- 0
- Sample size (n)
- 250
- 95% confidence interval
- -0.8852 to -0.8176
- Granger causality
- None
- Granger optimal lag
- 1
AI analysis
Analysis: Treasury 3-Month Yield vs. Time-Indexed Series (Labeled as BTC/USDT)
Note on data labeling: The axis labels appear swapped or mismatched — the "X-axis" is described as Treasury yield data while values are actually Unix timestamps spanning all of 2024, and the Y-axis (labeled BTC/USDT OHLCV) contains values between 4.3–5.5, which are clearly interest rate levels (%), not crypto prices. This analysis treats X as time and Y as the 3-Month Treasury Par Yield (%), which is what the actual data represents.
1. What the Visualization Reveals The scatterplot shows a clear temporal trend in short-term Treasury yields over 2024. Yields remain elevated (~5.4–5.5%) through the first half of the year, then begin a pronounced decline starting around August/September, falling to roughly 4.3–4.7% by December. This is consistent with the Federal Reserve's rate-cutting cycle that began in September 2024.
2. Strength and Direction of the Relationship The correlation coefficient (r = -0.855) indicates a strong negative relationship between time and yield levels — unsurprising given this is a monotonic-ish decline rather than a relationship between two independent economic variables. The r² of 0.731 means 73% of the variance in yield levels is explained by the linear time trend, though the relationship is clearly not purely linear (see below). The tight 95% CI [-0.885, -0.818] and p-value of 0 reflect the large N (250 daily observations) and the strength of the trend, giving high statistical confidence that this is a real, non-random pattern rather than noise. The Granger causality test is essentially meaningless here since one variable is time — time cannot be "caused" by yield, and the near-zero F-statistics (0.077, 0.792) simply confirm no lagged predictive structure, as expected for a trend-dominated series.
3. Notable Patterns and Non-Linear Features The data clearly shows two distinct regimes rather than a smooth linear decay: - Plateau phase (Jan–Aug 2024): Yields hover tightly in the 5.4–5.5% band with low volatility. - Decline phase (Sep–Dec 2024): A steep, fairly steady drop to ~4.3–4.7%.
This step-like or "plateau-then-slope" shape means a simple linear fit (R²=0.731) understates the tightness of fit within each regime — a piecewise or logistic/sigmoid model would likely capture the pattern far better than a straight line.
4. Confounding Factors and Caveats - Autocorrelation: Daily yield data is highly autocorrelated (today's yield strongly predicts tomorrow's), which inflates apparent correlation strength and invalidates standard significance testing assumptions (the "N=250 independent observations" premise is questionable). - Trend-driven correlation: Correlating a rate series against calendar time captures a policy-driven trend, not a causal economic relationship — the negative "correlation" reflects Fed decisions, not an interaction between two independent phenomena. - Mislabeled axes: The dataset descriptions suggest a mismatch between intended variables (BTC price vs. Treasury yield). Any crypto-related interpretation of this chart would be invalid given the actual value ranges.
5. Suggestions for Further Investigation - Correct the data source mapping to confirm what is actually being compared (e.g., BTC/USDT close price vs. 3-Mo yield) — the current chart only shows yield vs. time. - If the original intent was BTC price vs. Treasury yield, that analysis should be rerun with correctly aligned columns, and stationarity-adjusted methods (e.g., differencing, cointegration tests) should replace raw Pearson correlation given both series are likely non-stationary trends. - Fit a piecewise linear or logistic curve to the yield-vs-time data to better characterize the timing and speed of the September rate-cut transition.
X dataset: CryptoDataDownload – Binance BTC/USDT Daily OHLCV
Y dataset: Daily Treasury Par Yield Curve Rates
Part of experiment: Bitcoin - CryptoDataDownload – Binance BTC/USDT Daily OHLCV vs Daily Treasury Par Yield Curve Rates