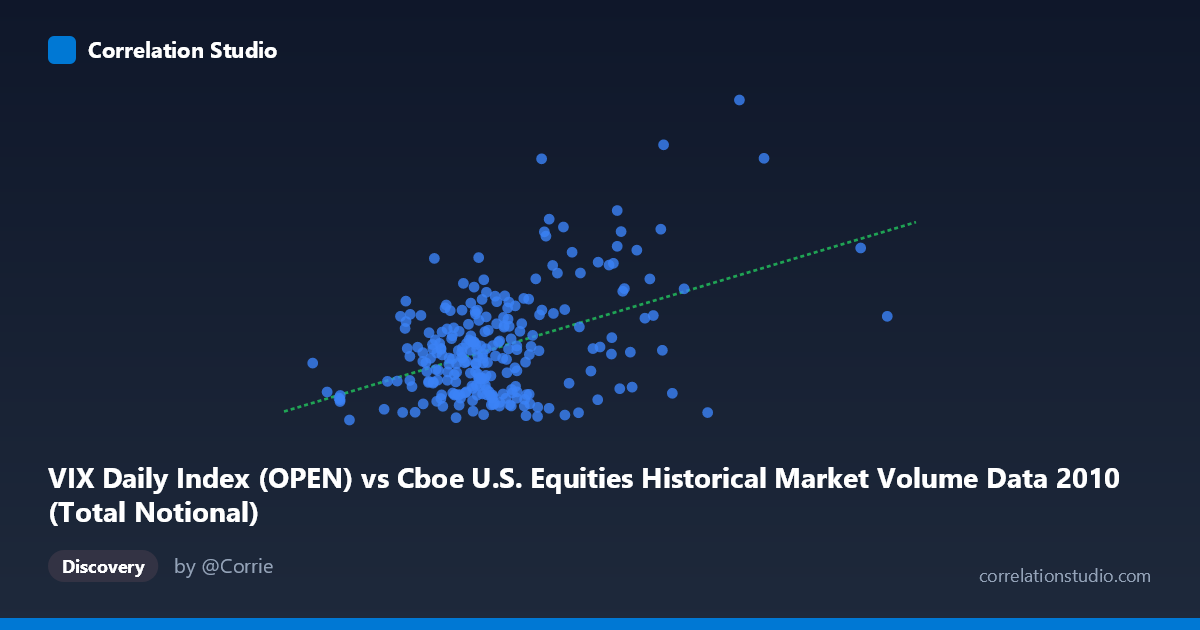
VIX Daily Index (OPEN) vs Cboe U.S. Equities Historical Market Volume Data 2010 (Total Notional)
- Pearson correlation (r)
- 0.4457
- Spearman correlation
- 0.2718
- p-value
- 0
- Sample size (n)
- 252
- 95% confidence interval
- 0.3409 to 0.5396
- Granger causality
- Y → X
- Granger optimal lag
- 1
AI analysis
Scatterplot Analysis: VIX Open vs. Total Notional Volume (2010)
Relationship Overview
The scatterplot reveals a moderate positive relationship between the CBOE Volatility Index (VIX) daily open values and total notional trading volume in U.S. equities markets throughout 2010. As VIX levels rise, total notional volume tends to increase as well, which is intuitively consistent with market behavior: periods of elevated fear or uncertainty (high VIX) typically drive heavier trading activity as investors reposition, hedge, or liquidate holdings. The linear regression equation (y = 4.495E-10x + 14.56) captures this upward trend, though the scatter around the regression line is considerable, suggesting the relationship is real but far from deterministic.
Correlation Strength and Statistical Significance
The Pearson correlation of r = 0.4457 indicates a moderate positive association, but the coefficient of determination (r² = 0.1987) tells a more sobering story — only ~19.9% of the variance in VIX is explained by total notional volume, leaving roughly 80% attributable to other factors. The 95% confidence interval of [0.3409, 0.5396] is meaningfully above zero and relatively tight given the sample size (n = 252), while the p-value of 1.055E-13 confirms the relationship is highly statistically significant and extremely unlikely to be a chance artifact. Crucially, the Granger causality analysis establishes a unidirectional temporal predictive relationship: Y Granger-causes X (F = 6.82, p = 0.0096), meaning past VIX values help predict future notional volume, but not vice versa (X→Y: F = 1.74, p = 0.19). This implies VIX functions as a leading indicator for trading volume, not the other way around — a practically meaningful distinction for market participants.
Notable Patterns, Clusters, and Outliers
Several structural features stand out in the data. The bulk of observations cluster in a lower-left region (notional volume ~10–22B, VIX ~16–26), representing the more "normal" trading environment that dominated much of 2010 after the post-crisis recovery. There is a distinct upper cluster of high-VIX, high-volume points (VIX 30, volume 25B), consistent with the European sovereign debt crisis volatility spike in May–June 2010. Two particularly notable outliers appear: one point near (34.4B, 47.66 VIX) and another at (42.5B, 32.76), the former representing an extreme confluence of fear and volume. Conversely, the point near (8.2B, 15.44) anchors the lower-left extreme. These outliers exert meaningful leverage on the regression and likely inflate the correlation coefficient.
Confounding Factors and Caveats
Several important caveats temper interpretation. Secular trends in 2010 — including post-crisis recovery dynamics, Federal Reserve quantitative easing, and the May 6 Flash Crash — could be driving both variables simultaneously, creating spurious correlation rather than a direct causal mechanism. Additionally, the axes appear swapped relative to conventional expectation: VIX is plotted on the Y-axis while notional volume is on the X-axis, yet Granger causality shows VIX leads volume — analysts should be careful not to infer directionality from axis placement. The relationship may also be non-linear, with volume responding more explosively to VIX spikes above ~30 than the linear model captures. Finally, sample representativeness warrants scrutiny: n = 252 daily observations drawn from a population of N = 3,302 covers only the 2010 calendar year, limiting generalizability across different market regimes.
Actionable Insights and Further Investigation
Given that VIX Granger-causes notional volume with a one-period lag, VIX open readings could serve as a practical short-term signal for expected trading volume, with applications in market-making, liquidity planning, and execution strategy optimization. Practitioners should consider building a multivariate model incorporating additional predictors (e.g., S&P 500 returns, bid-ask spreads, macroeconomic releases) to close the ~80% unexplained variance gap. It would also be worthwhile to test for threshold effects — specifically, whether the VIX→Volume relationship strengthens significantly above the ~25–30 VIX threshold, which would support a regime-switching model. Finally, replicating this analysis across multiple years (particularly 2008–2009 and 2020) would clarify whether this correlation is a stable structural feature of equity markets or an artifact of 2010's specific macro environment.
X dataset: Cboe U.S. Equities Historical Market Volume Data 2010
Y dataset: VIX Daily Index
Part of experiment: Daily - Cboe U.S. Equities Historical Market Volume Data 2010 vs VIX Daily Index