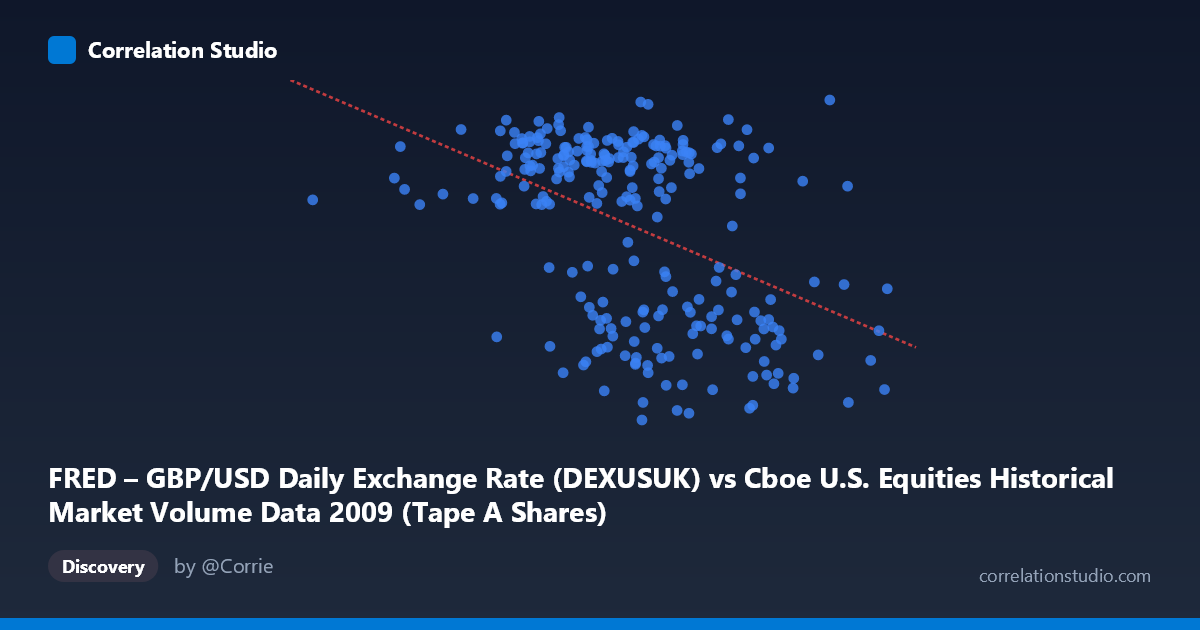
FRED – GBP/USD Daily Exchange Rate (DEXUSUK) vs Cboe U.S. Equities Historical Market Volume Data 2009 (Tape A Shares)
- Pearson correlation (r)
- -0.4414
- Spearman correlation
- -0.392
- p-value
- 0
- Sample size (n)
- 250
- 95% confidence interval
- -0.5361 to -0.3357
- Granger causality
- None
- Granger optimal lag
- 1
AI analysis
Analysis: GBP/USD Exchange Rate vs. Cboe U.S. Equities Market Volume (2009)
Relationship Overview The scatterplot reveals a negative relationship between U.S. equity market trading volume (X-axis) and the GBP/USD exchange rate (Y-axis) across 2009 trading days. As daily equity market volume increases, the pound tends to weaken relative to the dollar. The linear regression equation (y = -4.256×10⁻¹⁰x + 1.754) captures this downward slope, though the data points exhibit considerable scatter around the regression line, suggesting the relationship is real but far from deterministic. Visually, the cloud of points spans a wide X range (~105M to ~704M shares) and a relatively compressed Y range (~1.37–1.70 USD/GBP), making the negative trend subtle but discernible.
Correlation Strength and Statistical Significance The correlation coefficient of r = -0.4414 indicates a moderate negative association — meaningful but not dominant. Critically, the R² of 0.1948 means that only about 19.5% of the variance in GBP/USD is explained by equity trading volume, leaving roughly 80% attributable to other factors. The 95% confidence interval of [-0.5361, -0.3357] is entirely negative and reasonably tight, reinforcing that the negative direction is reliable rather than a statistical artifact. The p-value of 2.42×10⁻¹³ is extraordinarily small given n=250, confirming the effect is highly statistically significant. However, statistical significance should not be conflated with practical magnitude — the explained variance remains modest. Most importantly, Granger causality tests fail in both directions (X→Y: p=0.730; Y→X: p=0.536), meaning neither variable reliably predicts the other's future values, strongly cautioning against any causal interpretation.
Notable Patterns and Outliers Several features stand out in the sample points. The extreme high-volume days (approaching 700M shares, e.g., 704,192,148) correspond to relatively lower GBP/USD values (~1.50), consistent with the negative trend. Conversely, low-volume days (e.g., ~105M–200M shares) appear associated with mid-to-upper exchange rate values (~1.59–1.60). There are also notable high-GBP/USD observations at moderate volumes (e.g., 1.67 at ~362M shares; 1.66 at ~492M), suggesting the relationship is noisy and non-monotonic in places. The Y-axis compression (1.37–1.70, a range of only ~0.33 USD) means even statistically detectable variation is practically narrow in forex terms. No dramatic single outliers dominate, but the variance in Y appears somewhat larger at intermediate X values, hinting at possible heteroscedasticity.
Confounding Factors and Caveats This correlation almost certainly reflects shared macroeconomic drivers rather than a direct mechanistic link. The year 2009 was dominated by the aftermath of the global financial crisis — periods of acute market stress drove both surges in trading volume (panic selling, deleveraging) and dollar strengthening (flight-to-safety flows), which would naturally produce a negative co-movement without any causal channel between the two variables. Additionally, the axis labels appear swapped in the dataset metadata (GBP/USD is listed under the Cboe dataset column and vice versa), which warrants data pipeline verification before drawing firm conclusions. The Granger causality null results further confirm that any observed correlation is likely contemporaneous and driven by common third factors such as risk sentiment, VIX levels, or Federal Reserve policy signals.
Actionable Insights and Further Investigation Given the moderate correlation and absent Granger causality, practitioners should not use equity volume to predict GBP/USD or vice versa in isolation. More productive next steps would include: (1) introducing risk-sentiment proxies (VIX, credit spreads) as control variables to test whether the correlation disappears once crisis dynamics are accounted for; (2) segmenting by market regime (e.g., pre/post March 2009 market bottom) to determine whether the relationship was driven by a specific crisis sub-period; (3) extending the time series beyond 2009 to test whether this correlation is a structural feature or a crisis-era artifact; and (4) verifying data alignment given the apparent axis-label transposition in the metadata. The high statistical significance with modest R² is a classic signal that a real but confounded relationship warrants deeper structural investigation rather than direct application.
X dataset: Cboe U.S. Equities Historical Market Volume Data 2009
Y dataset: FRED – GBP/USD Daily Exchange Rate
Part of experiment: Daily - Cboe U.S. Equities Historical Market Volume Data 2009 vs FRED – GBP/USD Daily Exchange Rate