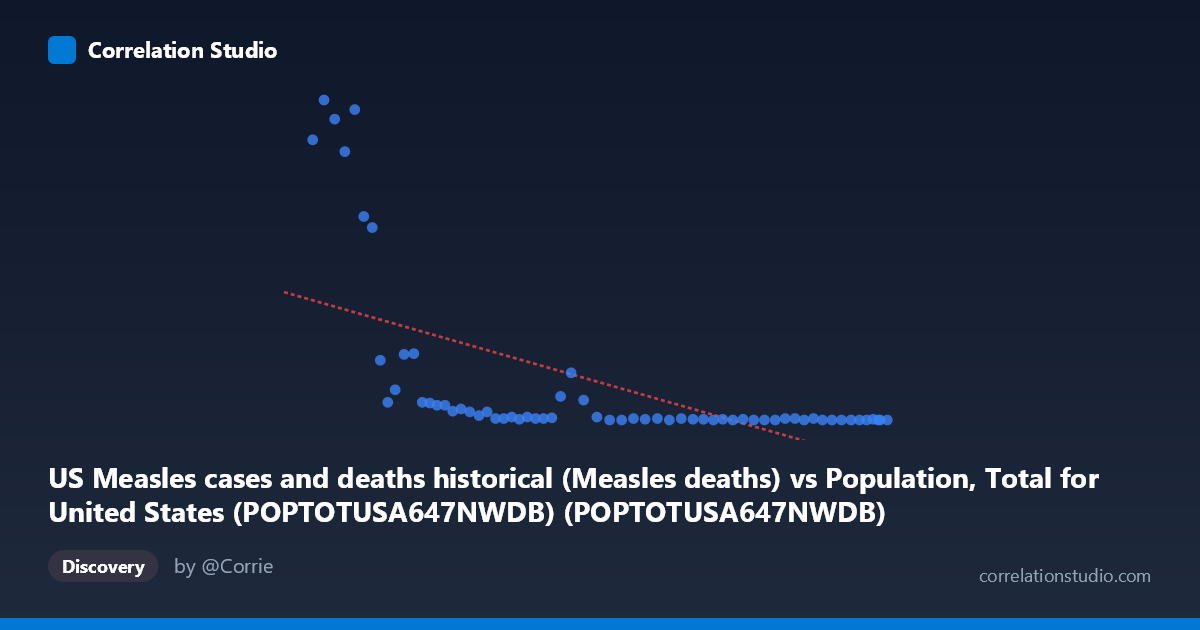
US Measles cases and deaths historical (Measles deaths) vs Population, Total for United States (POPTOTUSA647NWDB) (POPTOTUSA647NWDB)
- Pearson correlation (r)
- -0.594
- Spearman correlation
- -0.8798
- p-value
- 0
- Sample size (n)
- 63
- 95% confidence interval
- -0.7338 to -0.406
- Granger causality
- None
- Granger optimal lag
- 10
AI analysis
Scatterplot Analysis: US Population vs. Measles Deaths
1. Overall Relationship Revealed
The scatterplot reveals a striking inverse relationship between total US population size and annual measles deaths — as the US population grew from roughly 180 million to 334 million between 1960 and 2022, measles deaths fell dramatically, from highs exceeding 400 deaths per year to effectively zero. The data points cluster into two visually distinct regions: a dense cluster of observations at very low death counts (near zero) corresponding to larger population values (post-vaccination era), and a dispersed set of higher death counts associated with smaller population values (earlier decades). This pattern immediately suggests that time is the underlying driver — both variables are evolving together across a historical trajectory rather than population size itself causing mortality reduction.
2. Correlation Strength, Direction, and Causality
The Pearson correlation of r = -0.594 indicates a moderate-to-strong negative correlation, but the variance explained — r² = 0.353 — means that only 35.3% of the variance in measles deaths is statistically attributable to population size, leaving nearly two-thirds of the variation unexplained by this linear model. The 95% confidence interval of [-0.734, -0.406] is entirely negative, confirming the direction is reliable, and the p-value of 2.86 × 10⁻⁷ makes this result highly statistically significant — the probability of observing this correlation by chance is negligibly small. However, Granger causality testing reveals no significant predictive directionality in either direction (X→Y: F = 1.98, p = 0.070; Y→X: F = 1.66, p = 0.135), meaning population size does not temporally predict measles deaths, nor vice versa. This is a critical finding — statistical correlation does not translate into predictive or causal power here.
3. Notable Patterns, Clusters, and Outliers
Several features stand out in the data distribution. There is a pronounced L-shaped or hyperbolic pattern rather than a clean linear relationship — deaths drop steeply and then plateau near zero, consistent with the note that Spearman ρ exceeds Pearson r, confirming a non-linear relationship (logarithmic or exponential decay would likely fit far better than the fitted linear model y = -1.453×10⁻⁶x + 424.81). The most extreme values — deaths of 408, 421, 434, 380, and 364 — all cluster at the lowest population values (~180–192 million), representing early 1960s observations just before widespread measles vaccination began in 1963. After approximately the 240 million population mark, deaths are almost universally at or near zero, with only a handful of single-digit exceptions. These near-zero values form a dense horizontal band that dominates the right half of the chart, suggesting a threshold effect rather than a gradual linear decline.
4. Confounding Factors and Interpretive Caveats
The most significant caveat is that population size is functioning here as a proxy for time — both variables are time-indexed from 1960 to 2022, and the true causal driver of declining measles deaths is almost certainly the introduction and expansion of the measles vaccine starting in 1963, not population growth itself. This is a classic case of spurious correlation driven by shared temporal trends: population grows monotonically over time, while measles deaths decline due to an independent public health intervention. Additional confounders include improvements in healthcare infrastructure, herd immunity thresholds reached at different points, changes in reporting standards, and periodic resurgences (e.g., the early 1990s outbreak) which may appear as outliers. The linear regression model's relatively modest R² further underscores that the relationship is not well-captured by a straight line, and any causal interpretation would be deeply misleading.
5. Actionable Insights and Further Investigation
Given these findings, several analytical next steps are warranted. First, replace the linear model with a logarithmic or exponential decay model to better capture the hyperbolic drop in deaths — this would almost certainly improve explained variance substantially. Second, introduce vaccination coverage rates as the primary independent variable rather than population, which would provide a far more mechanistically meaningful correlation and likely explain a much greater share of variance. Third, conduct a structural break analysis around 1963–1968 (vaccine introduction) and 1989 (two-dose recommendation) to formally identify inflection points in the death series. Fourth, examine measles cases alongside deaths to assess whether the case fatality rate itself changed over time, which would separate the effects of infection prevention from treatment improvements. Finally, reframing this analysis as a time-series decomposition — separating trend, seasonal, and intervention effects — would yield far more actionable public health insights than a cross-sectional correlation between population and mortality.
X dataset: Population, Total for United States (POPTOTUSA647NWDB)
Y dataset: US Measles cases and deaths historical
Part of experiment: Yearly - Population, Total for United States (POPTOTUSA647NWDB) vs US Measles cases and deaths historical